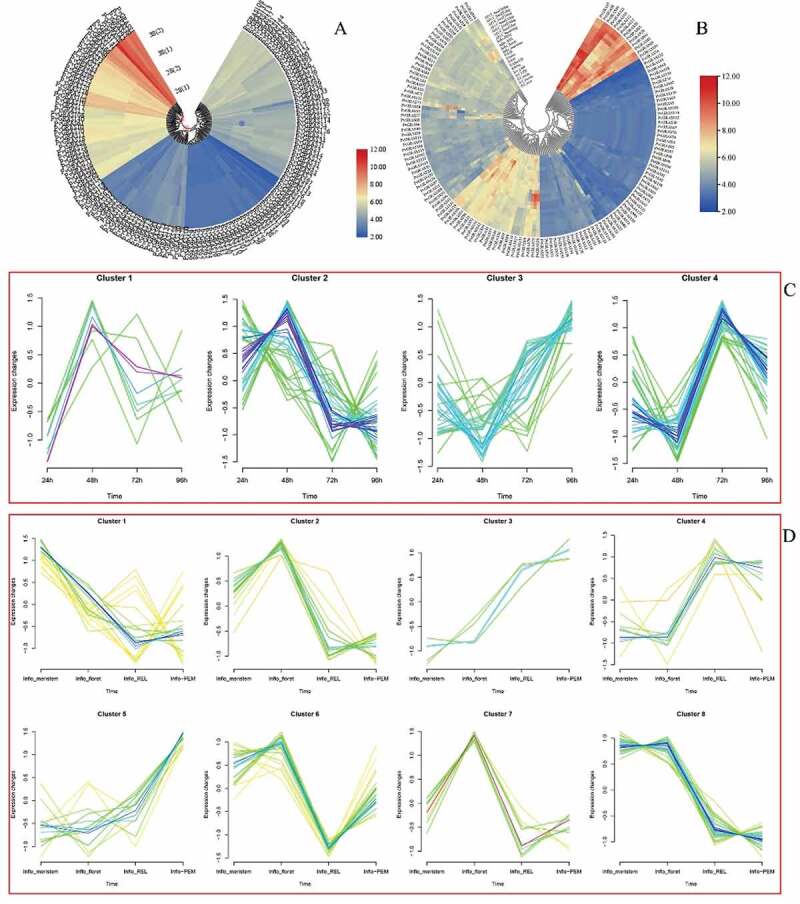
Figure 12.

GRAS genes expression pattern analysis. a. genes expression in different temperature. b. The PVGRAS genes special expression profiles in different tissues. c. Time-dependent cluster analysis. a Clustering according to changes in expression levels at different time (24, 48, 72, 96 h) points during seed germination. b Clustering according to changes in different development stages (meristem initiation, floret development, Rachis and brach elongation, Panicle emergence) during inflorescence development
