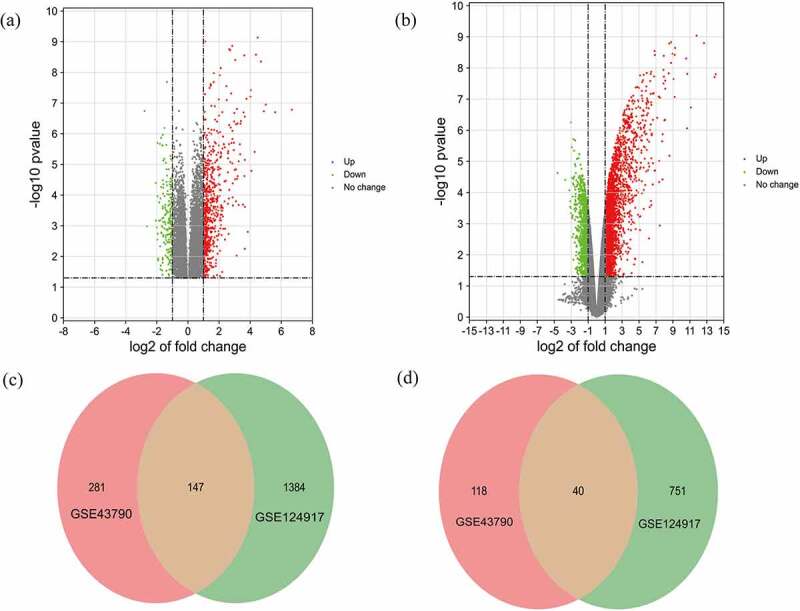
Figure 3.

Volcano maps of the distributions of all DEGs in (a) GSE43790 and (b) GSE124917. Red, green, and gray colors respectively represent up-regulated genes, down-regulated genes, and genes with no difference in expression. Venn diagrams showing (c) 147 up-regulated DEGs and (d) 40 down-regulated genes common to both GSE43790 and GSE124917
