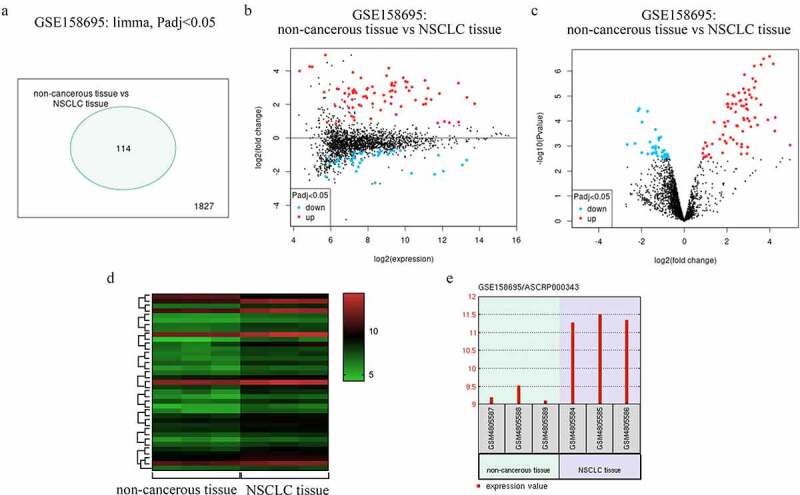
Figure 1.

NSCLC patient circRNA profiling results. (a) Differentially expressed circRNAs. (b) Mean-difference plot for the GSE158695 dataset. (c) Differentially expressed genes in the GSE158695 dataset were presented using a Volcano plot. (d) Genes upregulated in the GSE158695 dataset were subjected to clustering analysis. (e) NSCLC samples exhibited circRNA_001846 is upregulation as compared to paracancerous tissue samples
