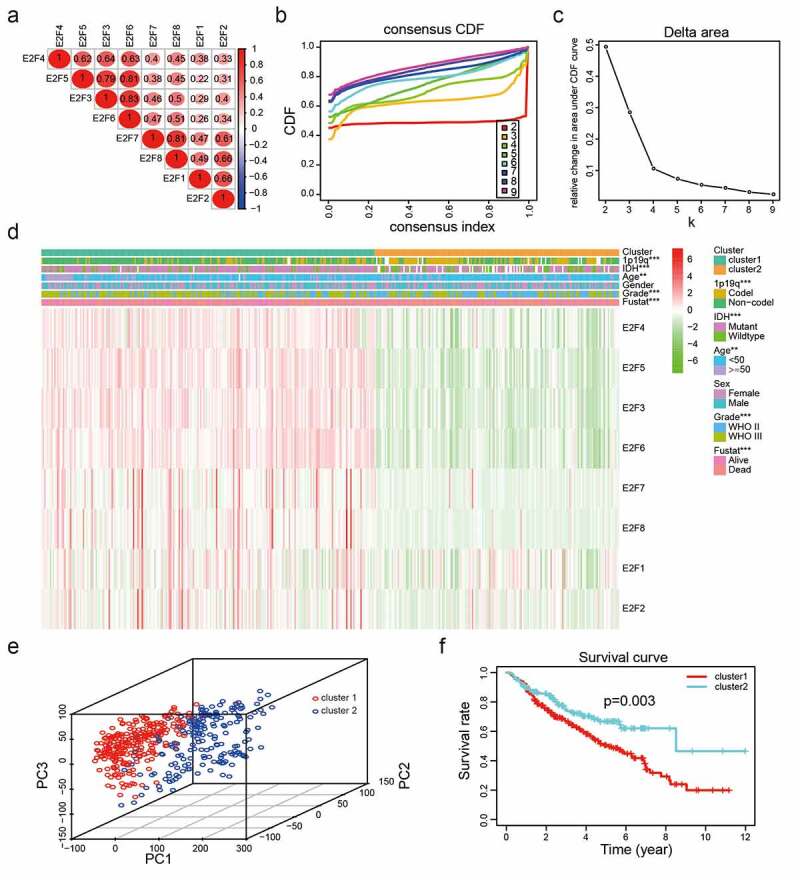
Figure 2.

Two categories of patients based on distinct clinical characteristics and OS according to the gene expression of eight E2Fs in the CGGA dataset. (a): Spearman’s correlation analysis of the E2F family members. (b): CDFs for K = 2–9. (c): Delta areas under the CDF curves for K = 2–9. (d): Clinical characteristics of the two clusters defined based on the consensus expression of the eight members of the E2F family. (e): PCA of total RNA expression profile in the CGGA datasets. (f): Kaplan-Meier curves for samples in the CGGA datasets
