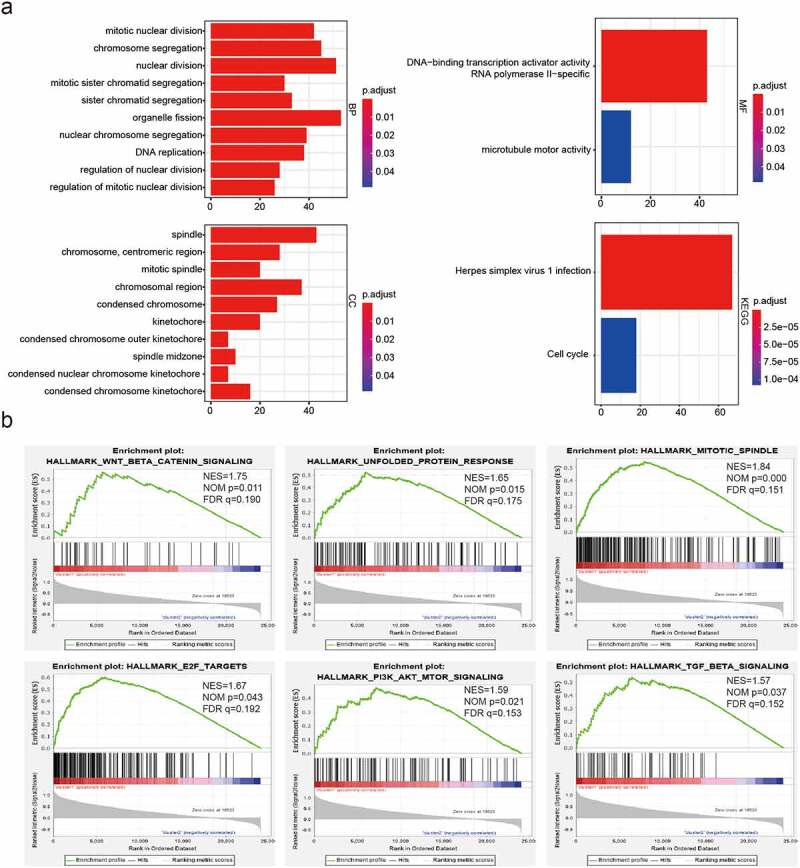
Figure 3.

Functional annotations of differentially expressed genes between cluster1 and cluster2. (a): Functional annotations of differentially expressed genes via GO and KEGG pathway analyses. (b): Malignant hallmarks enriched in cluster1 determined using GSEA
