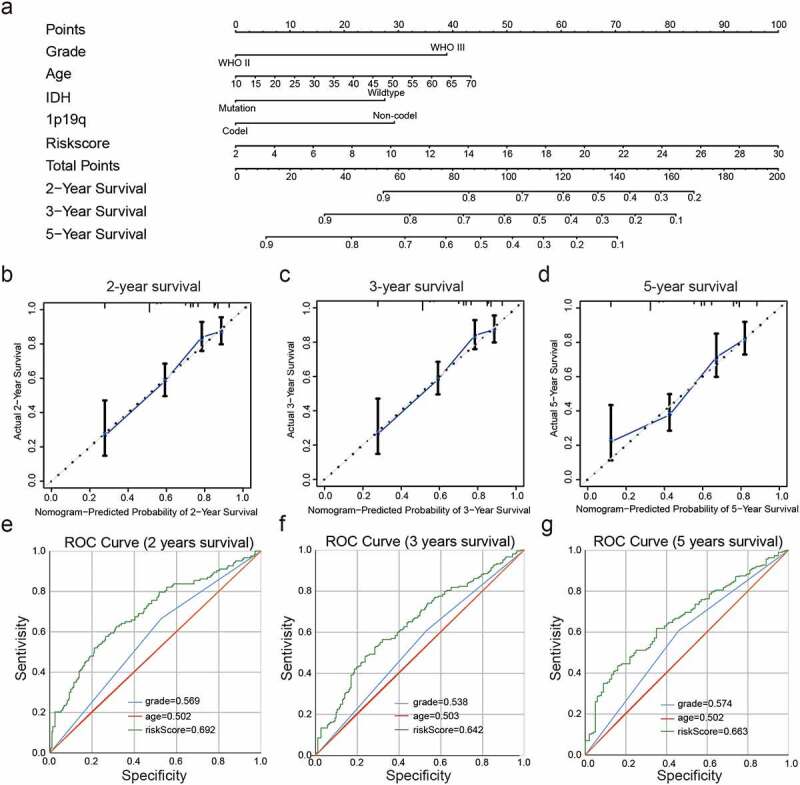
Figure 6.

Construction and assessment of a nomogram to predict patient’ OS. (a): Nomogram based on the clinical characteristics and risk scores for predicting patient survival. (b-d): Calibration curve for predicting patient survival at 2 years (b), 3 years (c), and 5 years (d). (e-g): The predictive efficiency of the risk scores, WHO grade, and age showed by ROC curves based on 2- (e), 3- (f), and 5- (g) year survival rates
