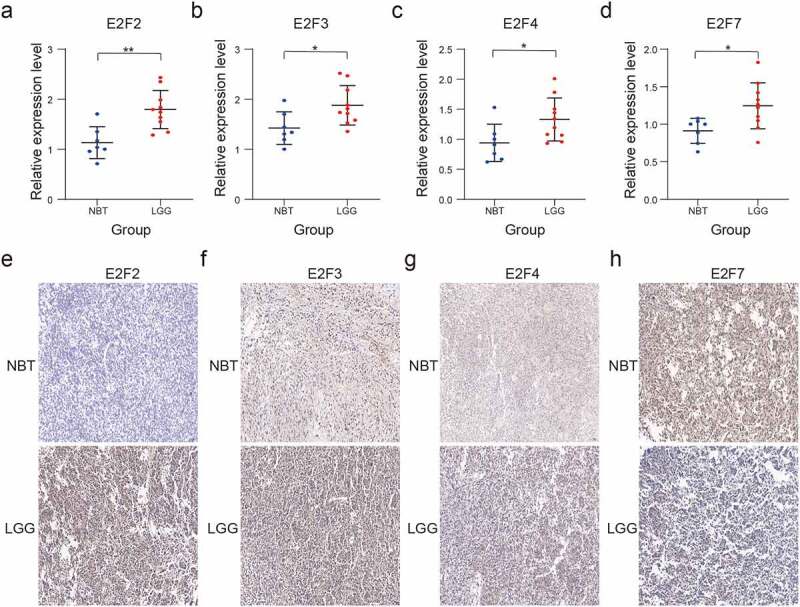
Figure 7.

Validation of four selected E2F members by RT-qPCR and immunohistochemistry analysis. (a-d): Comparative E2F2 (a), E2F3 (b), E2F4 (c), and E2F7 (d) mRNA expression levels in NBT and LGG tissues. (e-h): Comparative E2F2 (e), E2F3 (f), E2F4 (g), and E2F7 (h) protein expression levels in NBT and LGG tissues by immunohistochemistry assay. ns P > 0.05, * P < 0.05, ** P < 0.01, and *** P < 0.001
