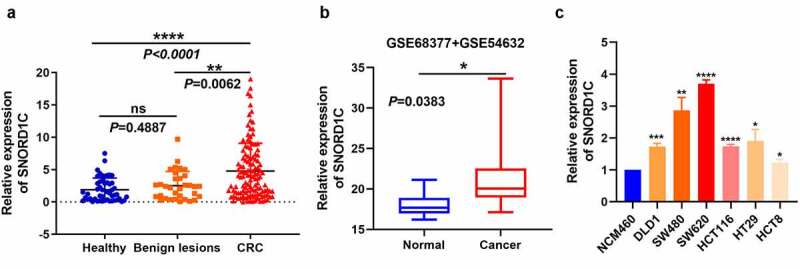
Figure 4.

Expression of serum SNORD1C in patients with CRC and GEO database. (a) Scatter plots of serum SNORD1C levels from patients with CRC (n = 122), benign lesions (n = 33), and healthy controls (n = 50). (b) mRNA levels of SNORD1C in CRC and paired adjacent non-cancerous tissues in GSE68377 and GSE54632. (c) Expression of SNORD1C in cell lines. All data are presented as mean ± standard deviation (SD). *P < 0.05; **P < 0.01; ****P < 0.0001
