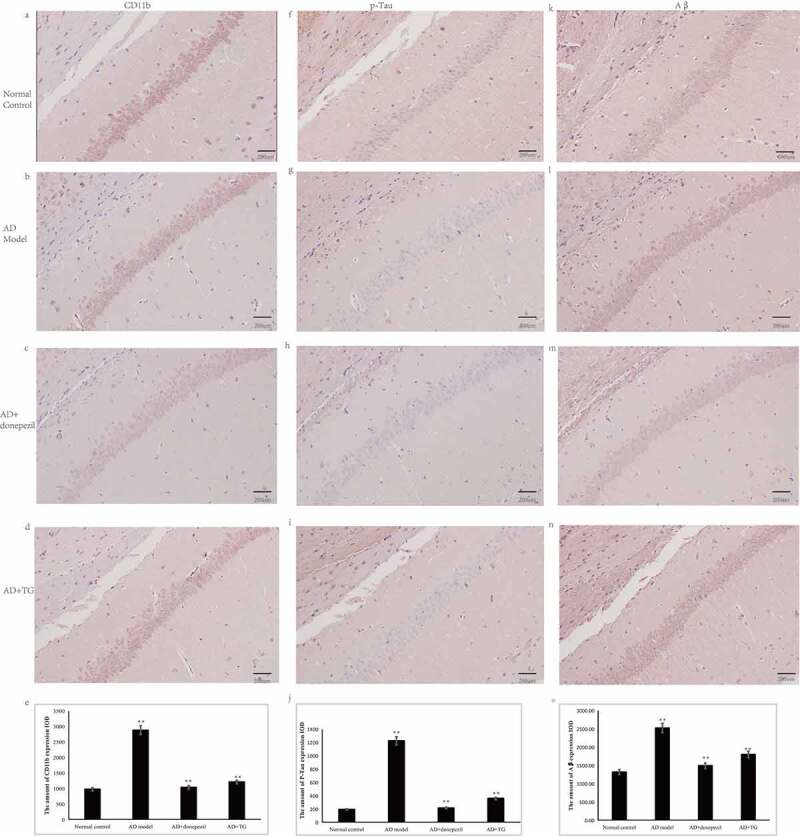
Figure 2.

The distribution of Aβ, p-Tau and CD11b immunolabeling across the brains in the AD+TG, AD+donepezil, AD model and Normal control groups. (a–e): The distribution of Aβ immunolabeling in the AD+TG, AD+donepezil, AD model and Normal control groups. (f–j): The distribution of p-Tau immunolabeling in the AD+TG, AD+donepezil, AD model and Normal control groups. (k–o): The distribution of CD11b immunolabeling in the AD+TG, AD+donepezil, AD model and Normal control groups. Data was expressed as the mean ± standard error of the mean (SEM). (n = 8/group in the AD+TG group; n = 8/group in the AD+donepezil group; n = 8/group in the AD model group; n = 8/group in the Normal control group). ‘**’ indicating significant inter-group difference. TG: Tripterygium glycoside; AD: Alzheimer disease; NS: normal saline
