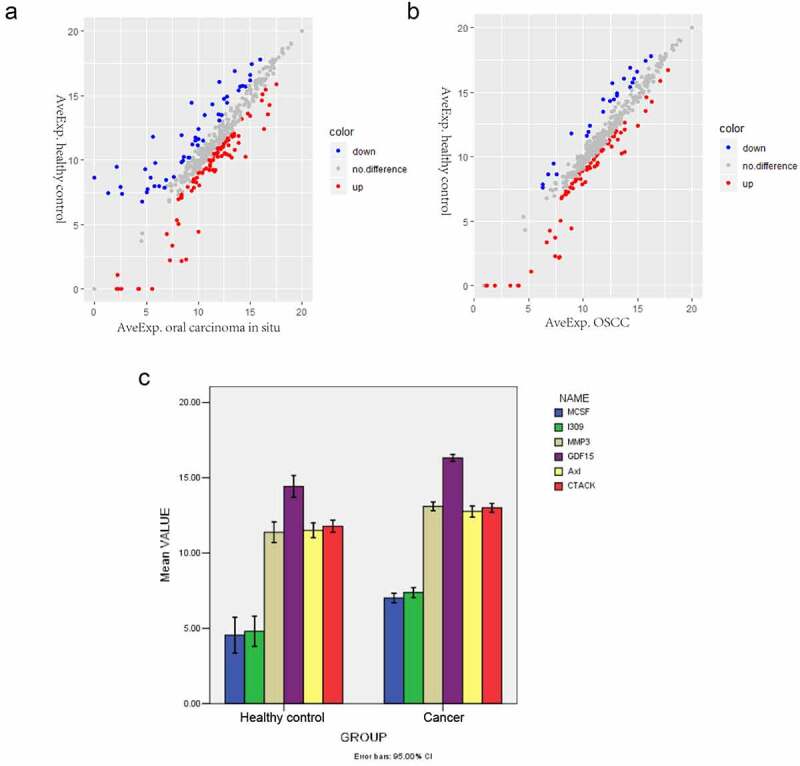
Figure 1.

Differentially expressed proteins in oral carcinoma in situ and OSCC. (a) Scatter plots of differentially expressed proteins between the oral carcinoma in situ group and the healthy control group. Red and Blue color indicated up- and down-regulation, respectively. (b) Scatter plots of differentially expressed proteins between the OSCC and the healthy control group. Red and Blue color indicated up- and down-regulation, respectively. (c) Comparison of the mean values of the significantly changed proteins between the cancer group and control normal group. The x-axis shows healthy control and cancer groups and y-axis shows mean values
