Figure 2.

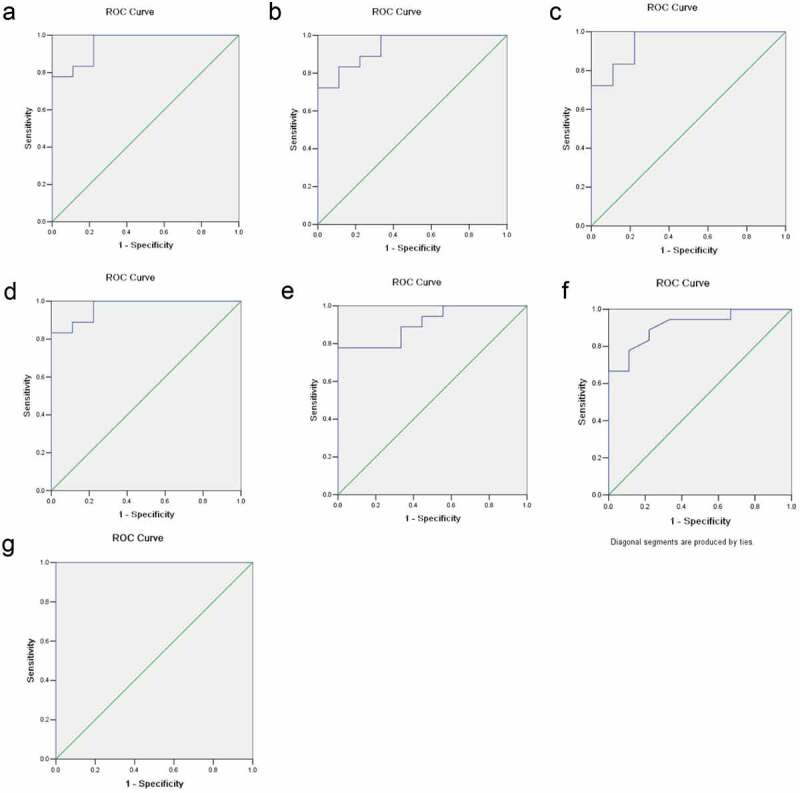
ROC curve analyses. The x-axis indicated specificity and y-axis indicated sensitivity. (a) GDF15. (b) MCSF. (c) I309. (d) MMP3. (f) CTACK. (e) AXL. (g) The combination of these six proteins

ROC curve analyses. The x-axis indicated specificity and y-axis indicated sensitivity. (a) GDF15. (b) MCSF. (c) I309. (d) MMP3. (f) CTACK. (e) AXL. (g) The combination of these six proteins