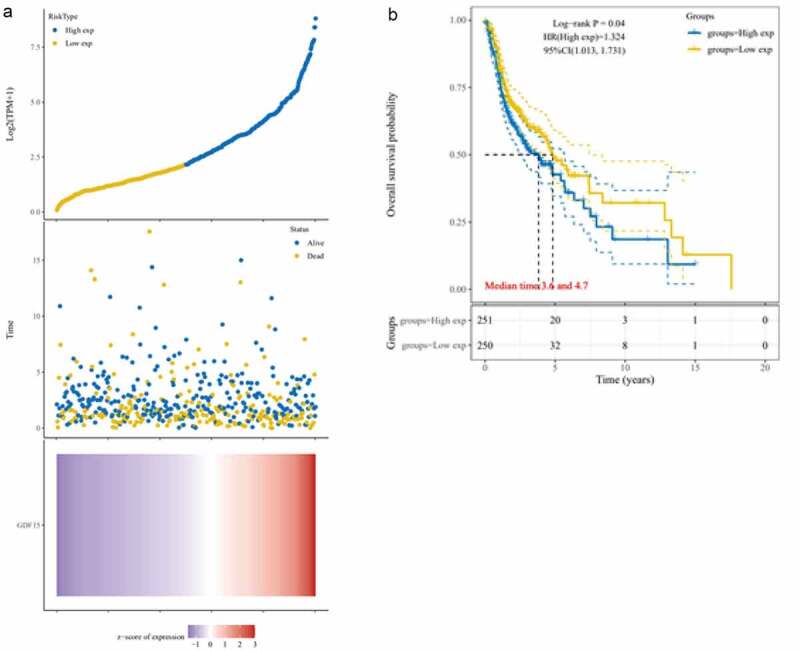
Figure 3.

Kaplan-Meier analysis in TCGA dataset. (a) Risk score distribution, survival overview, and hierarchical clustering for OSCC patients in TCGA cohort. (b) The overall survival curves of the GDF15 high expression and low expression groups in TCGA cohort
