
Figure 2.
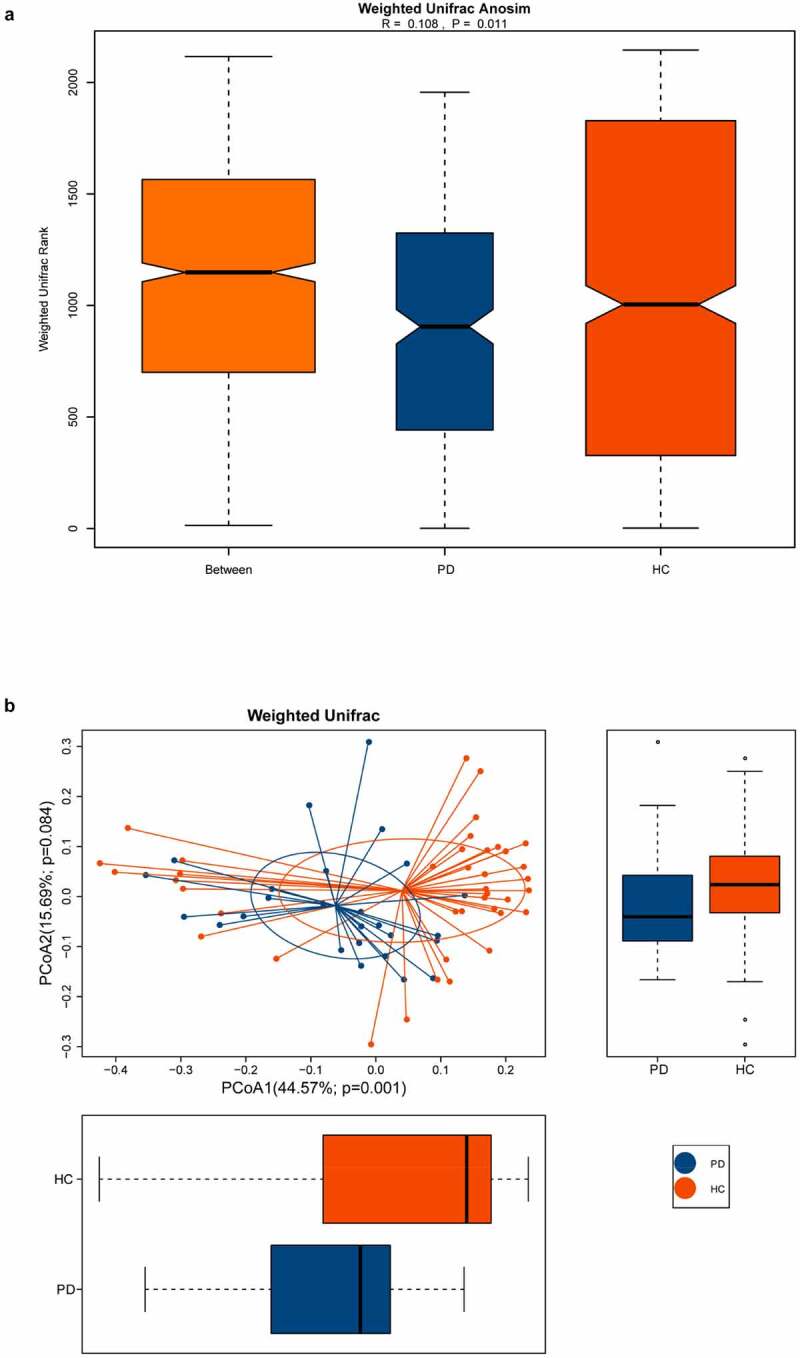
The beta diversity of the oral microbiota between PD patients and healthy controls
The beta diversity was measured with weighted ANOSIM and weighted PCOA. (A) Based on the UniFrac algorithm, ANOSIM analysis showed that the difference among the groups was greater than the difference within the groups (R = 0.108, p = 0.011). (B) The horizontal and vertical axes represent the first and second principal coordinates explaining the greatest proportion of variance to the bacteria communities (showed by percentage). PD, panic disorder; HC, healthy controls; PCOA, principal coordinates analysis; ANOSIM, analysis of similarities.