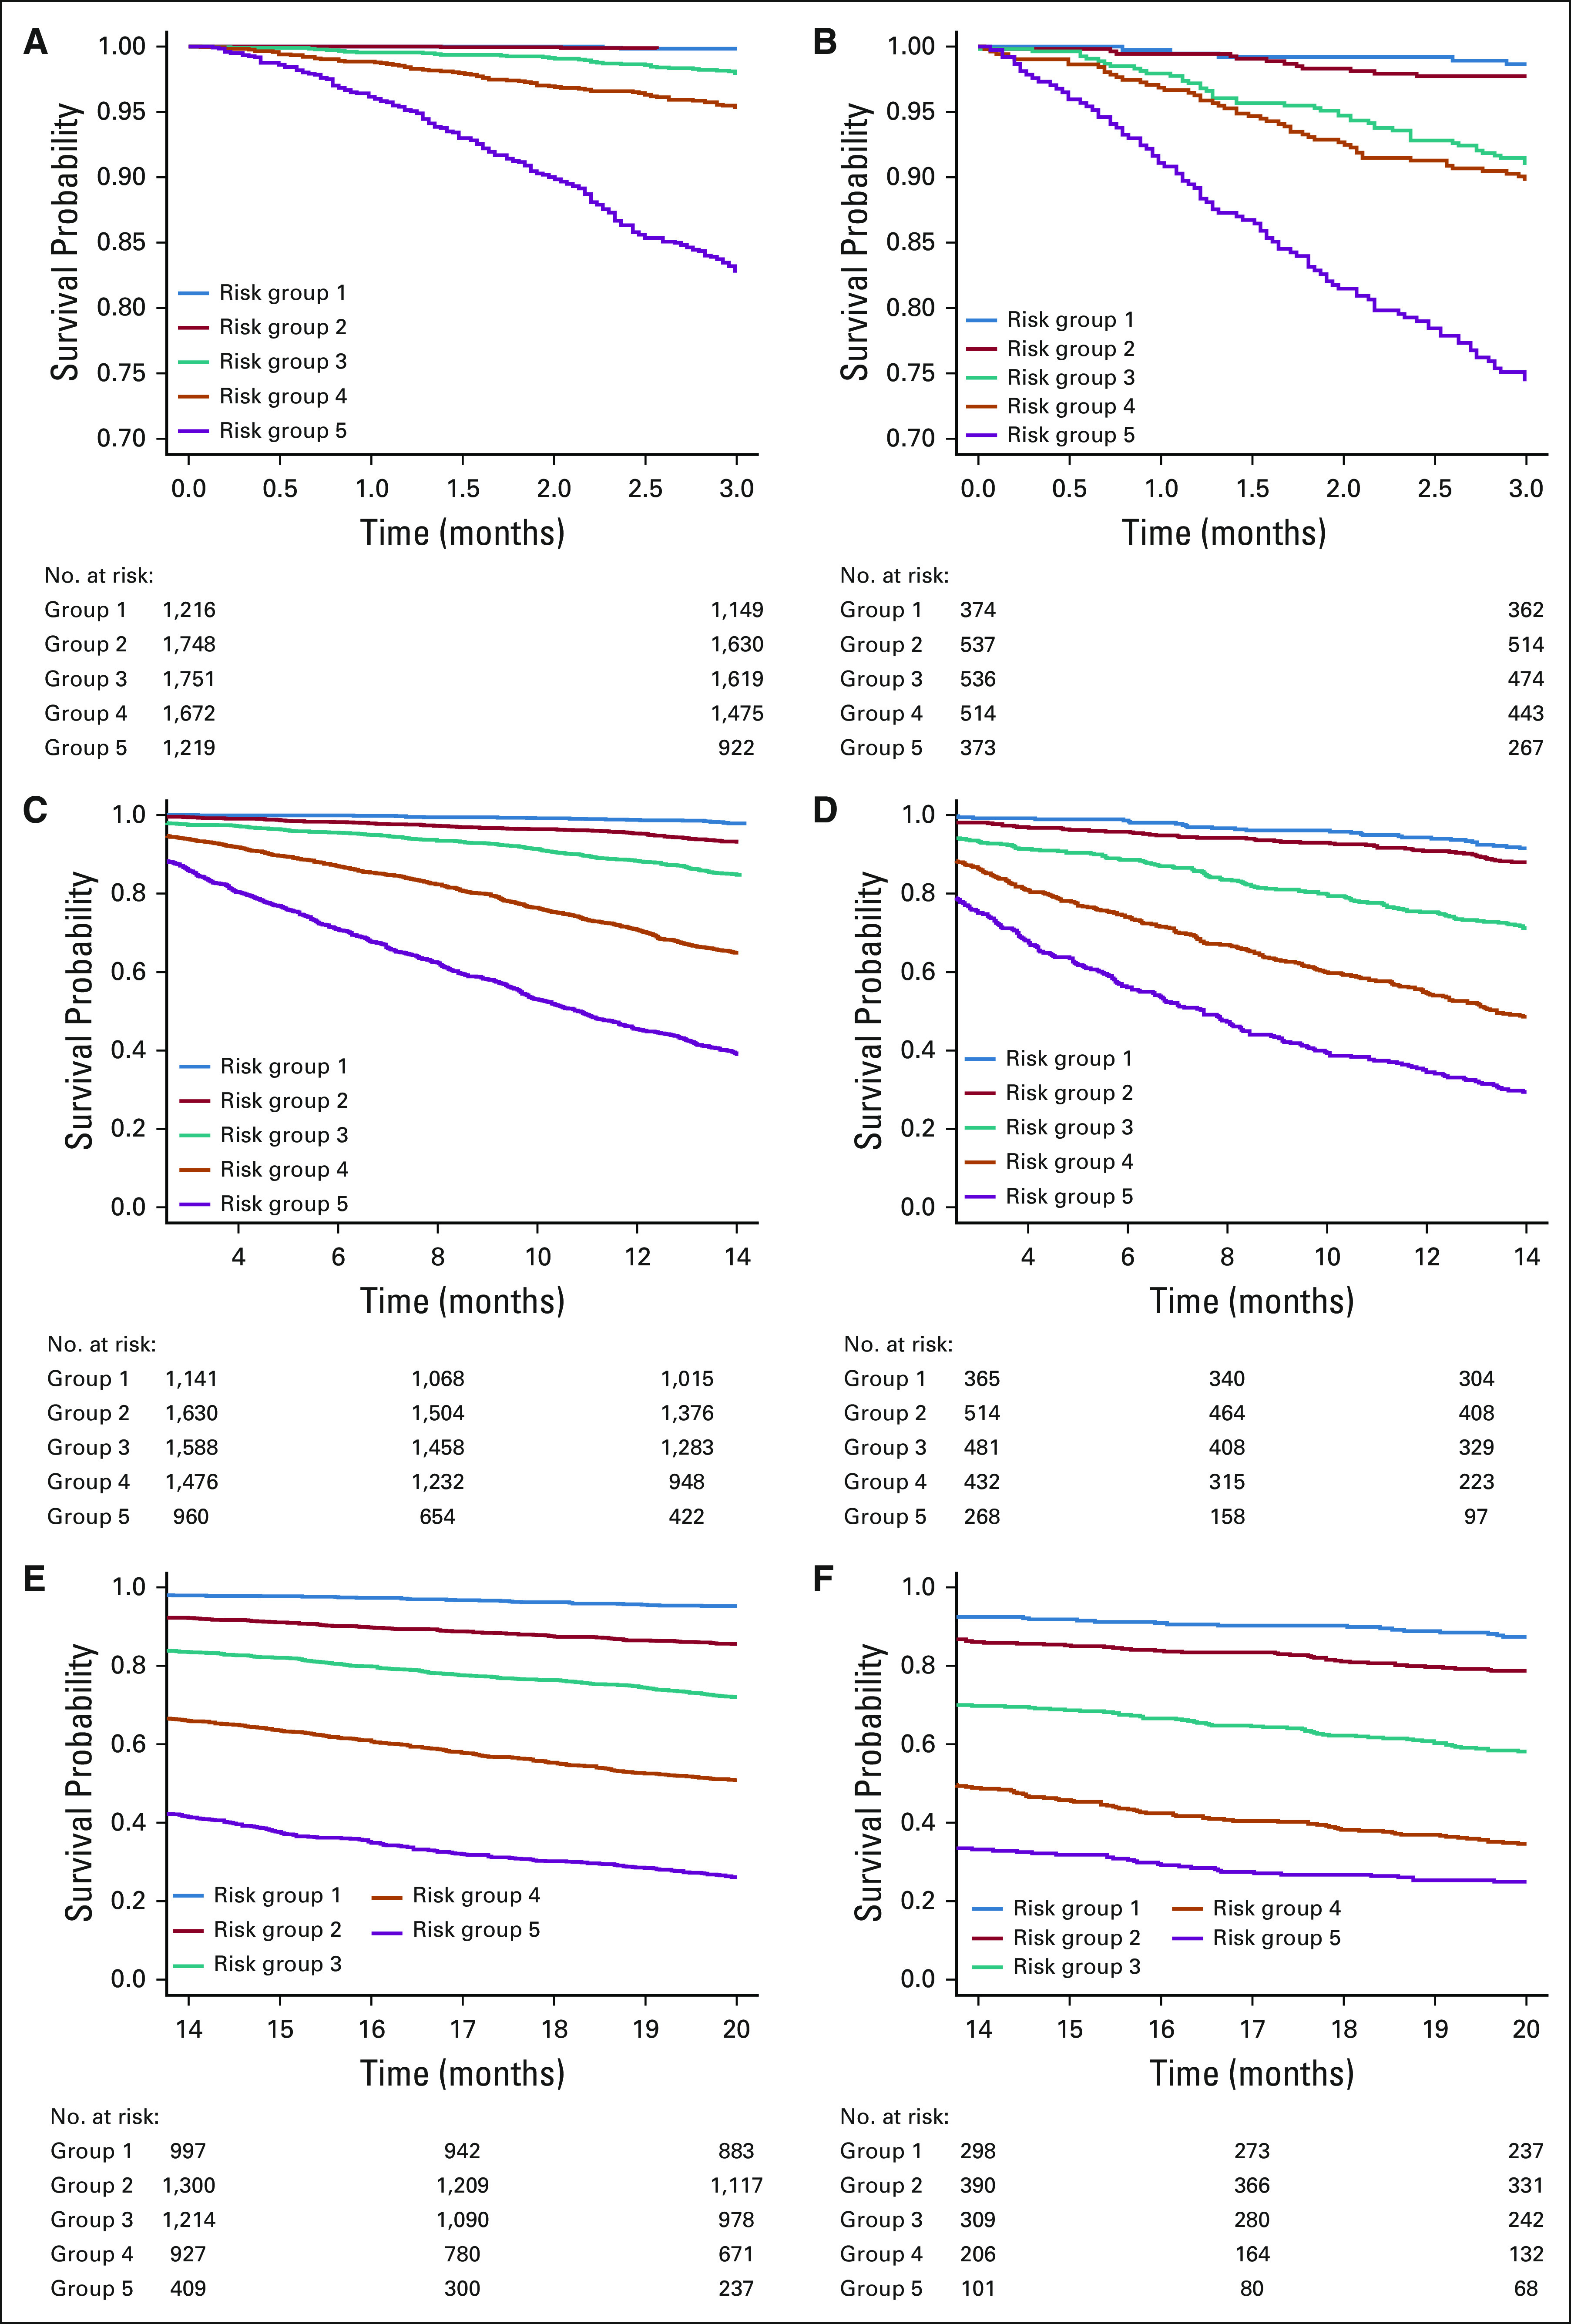
FIG 1.

Kaplan-Meier overall survival curves for the training versus validation cohorts by risk groups formed by prognostic index percentiles on the basis of models e1, e2, and e3. (A) Kaplan-Meier curve for training cohort by risk groups formed by prognostic index percentiles on the basis of model e1. Solid blue line indicates risk group 1 (prognostic index ≤ 16th percentiles); solid red line indicates risk group 2 (16th percentiles < prognostic index ≤ 39th percentiles); solid green line indicates risk group 3 (39th percentiles < prognostic index ≤ 62th percentiles); solid orange line indicates risk group 4 (62th percentiles < prognostic index ≤ 84th percentiles); and solid purple line indicates risk group 5 (prognostic index > 84th percentiles); numbers at risk by risk group are presented (by the order of risk group); risk group 1 and risk group 2 are overlapping. (B) Kaplan-Meier curve for validation cohort by risk groups formed by prognostic index percentiles on the basis of model e1. (C) Kaplan-Meier curve for training cohort by risk groups formed by prognostic index percentiles on the basis of model e2. (D) Kaplan-Meier curve for validation cohort by risk groups formed by prognostic index percentiles on the basis of model e2. (E) Kaplan-Meier curve for training cohort by risk groups formed by prognostic index percentiles on the basis of model e3. (F) Kaplan-Meier curve for validation cohort by risk groups formed by prognostic index percentiles on the basis of model e3.
