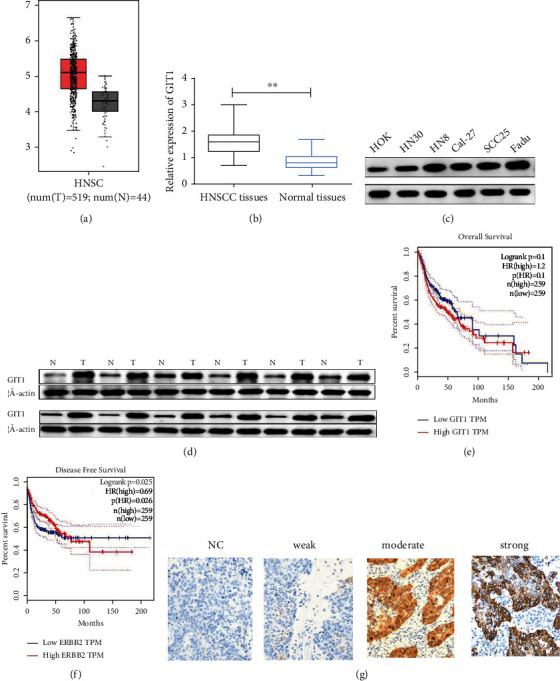
Figure 1.

GIT1 was markedly upregulated in HNSCC tissues and cell lines and associated with poor prognosis in HNSCC. (a) GEPIA dataset showed that GIT1 was upregulated in 519 HNSCC tissues relative to 44 normal tissues. (b) GIT1 was higher expressed in HNSCC tissues than in normal tissues. (c) The protein expression of GIT1 was increased in HNSCC cell lines (HN30, HN8, Cal-27, SCC25, and FaDu) compared with in HOK cells. (d) The protein expression of GIT1 was obviously higher in HNSCC tissues than in normal tissues. (e) GEPIA dataset displayed that GIT1 expression had no significance on OS probability of HNSCC patients. (f) GEPIA dataset displayed that high GIT1 expression had a significant low DFS probability. (g) IHC assay of GIT1 expression in tissues microarrays was shown (relatively weak, moderate, and strong staining). ∗∗p < 0.01.
