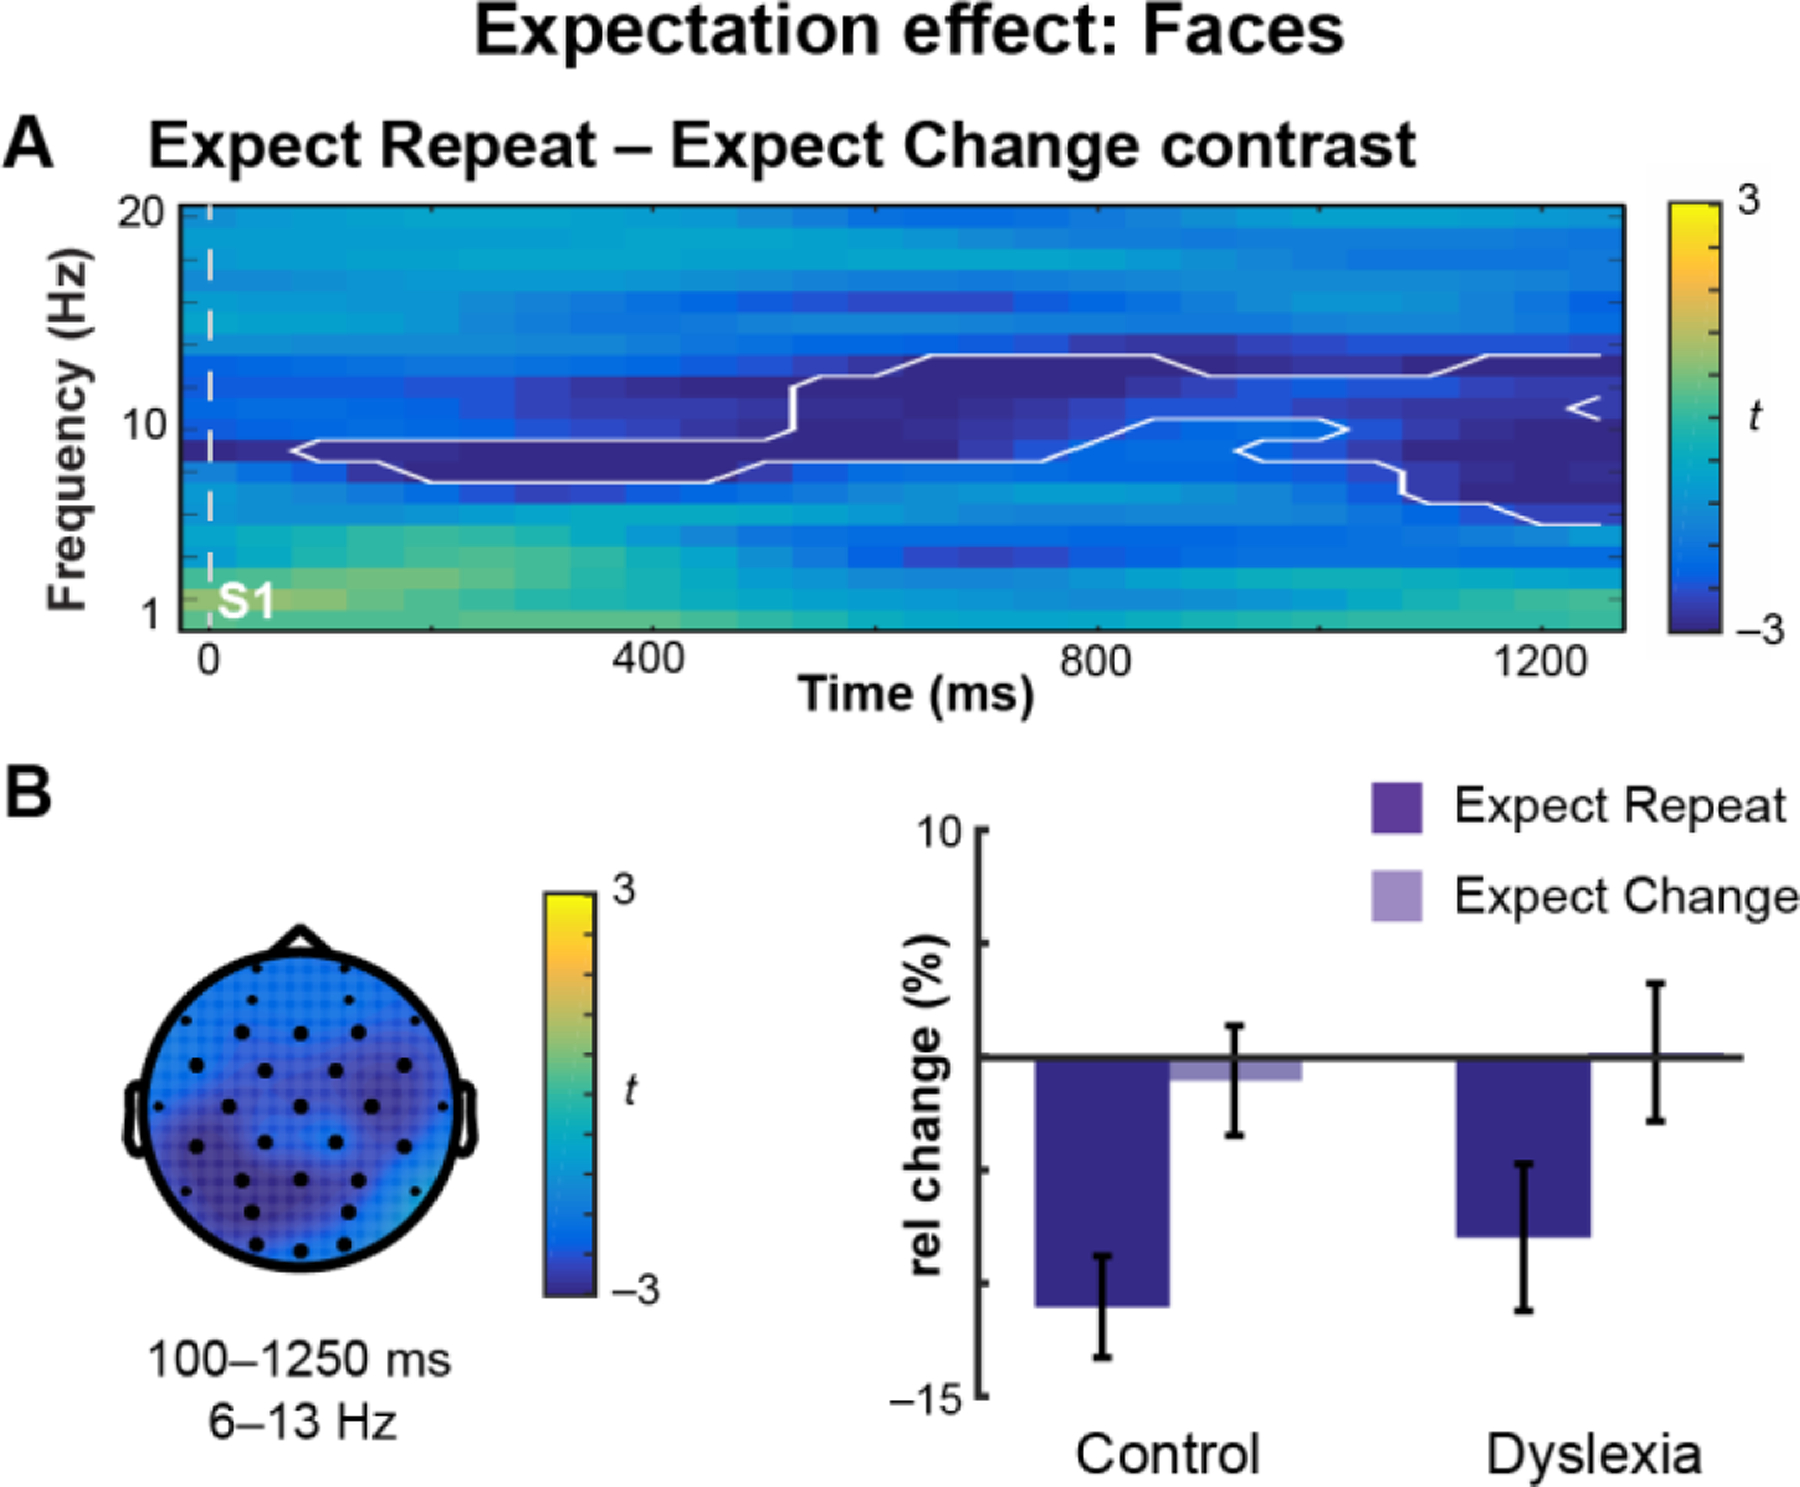
Figure 2. Expectation of face repetition versus change modulates neural oscillations.

(A) Oscillatory power prior to S2 onset plotted in Control subjects as a time-frequency representation of the Expect Repeat – Expect Change contrast, where color indicates the t-statistic. One extended cluster (white outline) was identified in the Control group. (B) Topographical plot of the cluster. The t-statistic is averaged over time and frequency. Dark electrodes belong to the cluster. Barplot of the mean-difference values extracted from the cluster for Control and Dyslexia groups, expressed as a percent change from baseline. Error bars represent (between-subjects) SEM. Both groups showed desynchronization in the Expect Repeat condition.
