
Figure 4. Reduced prediction error in dyslexia for unexpected changes versus expected repetitions of faces.
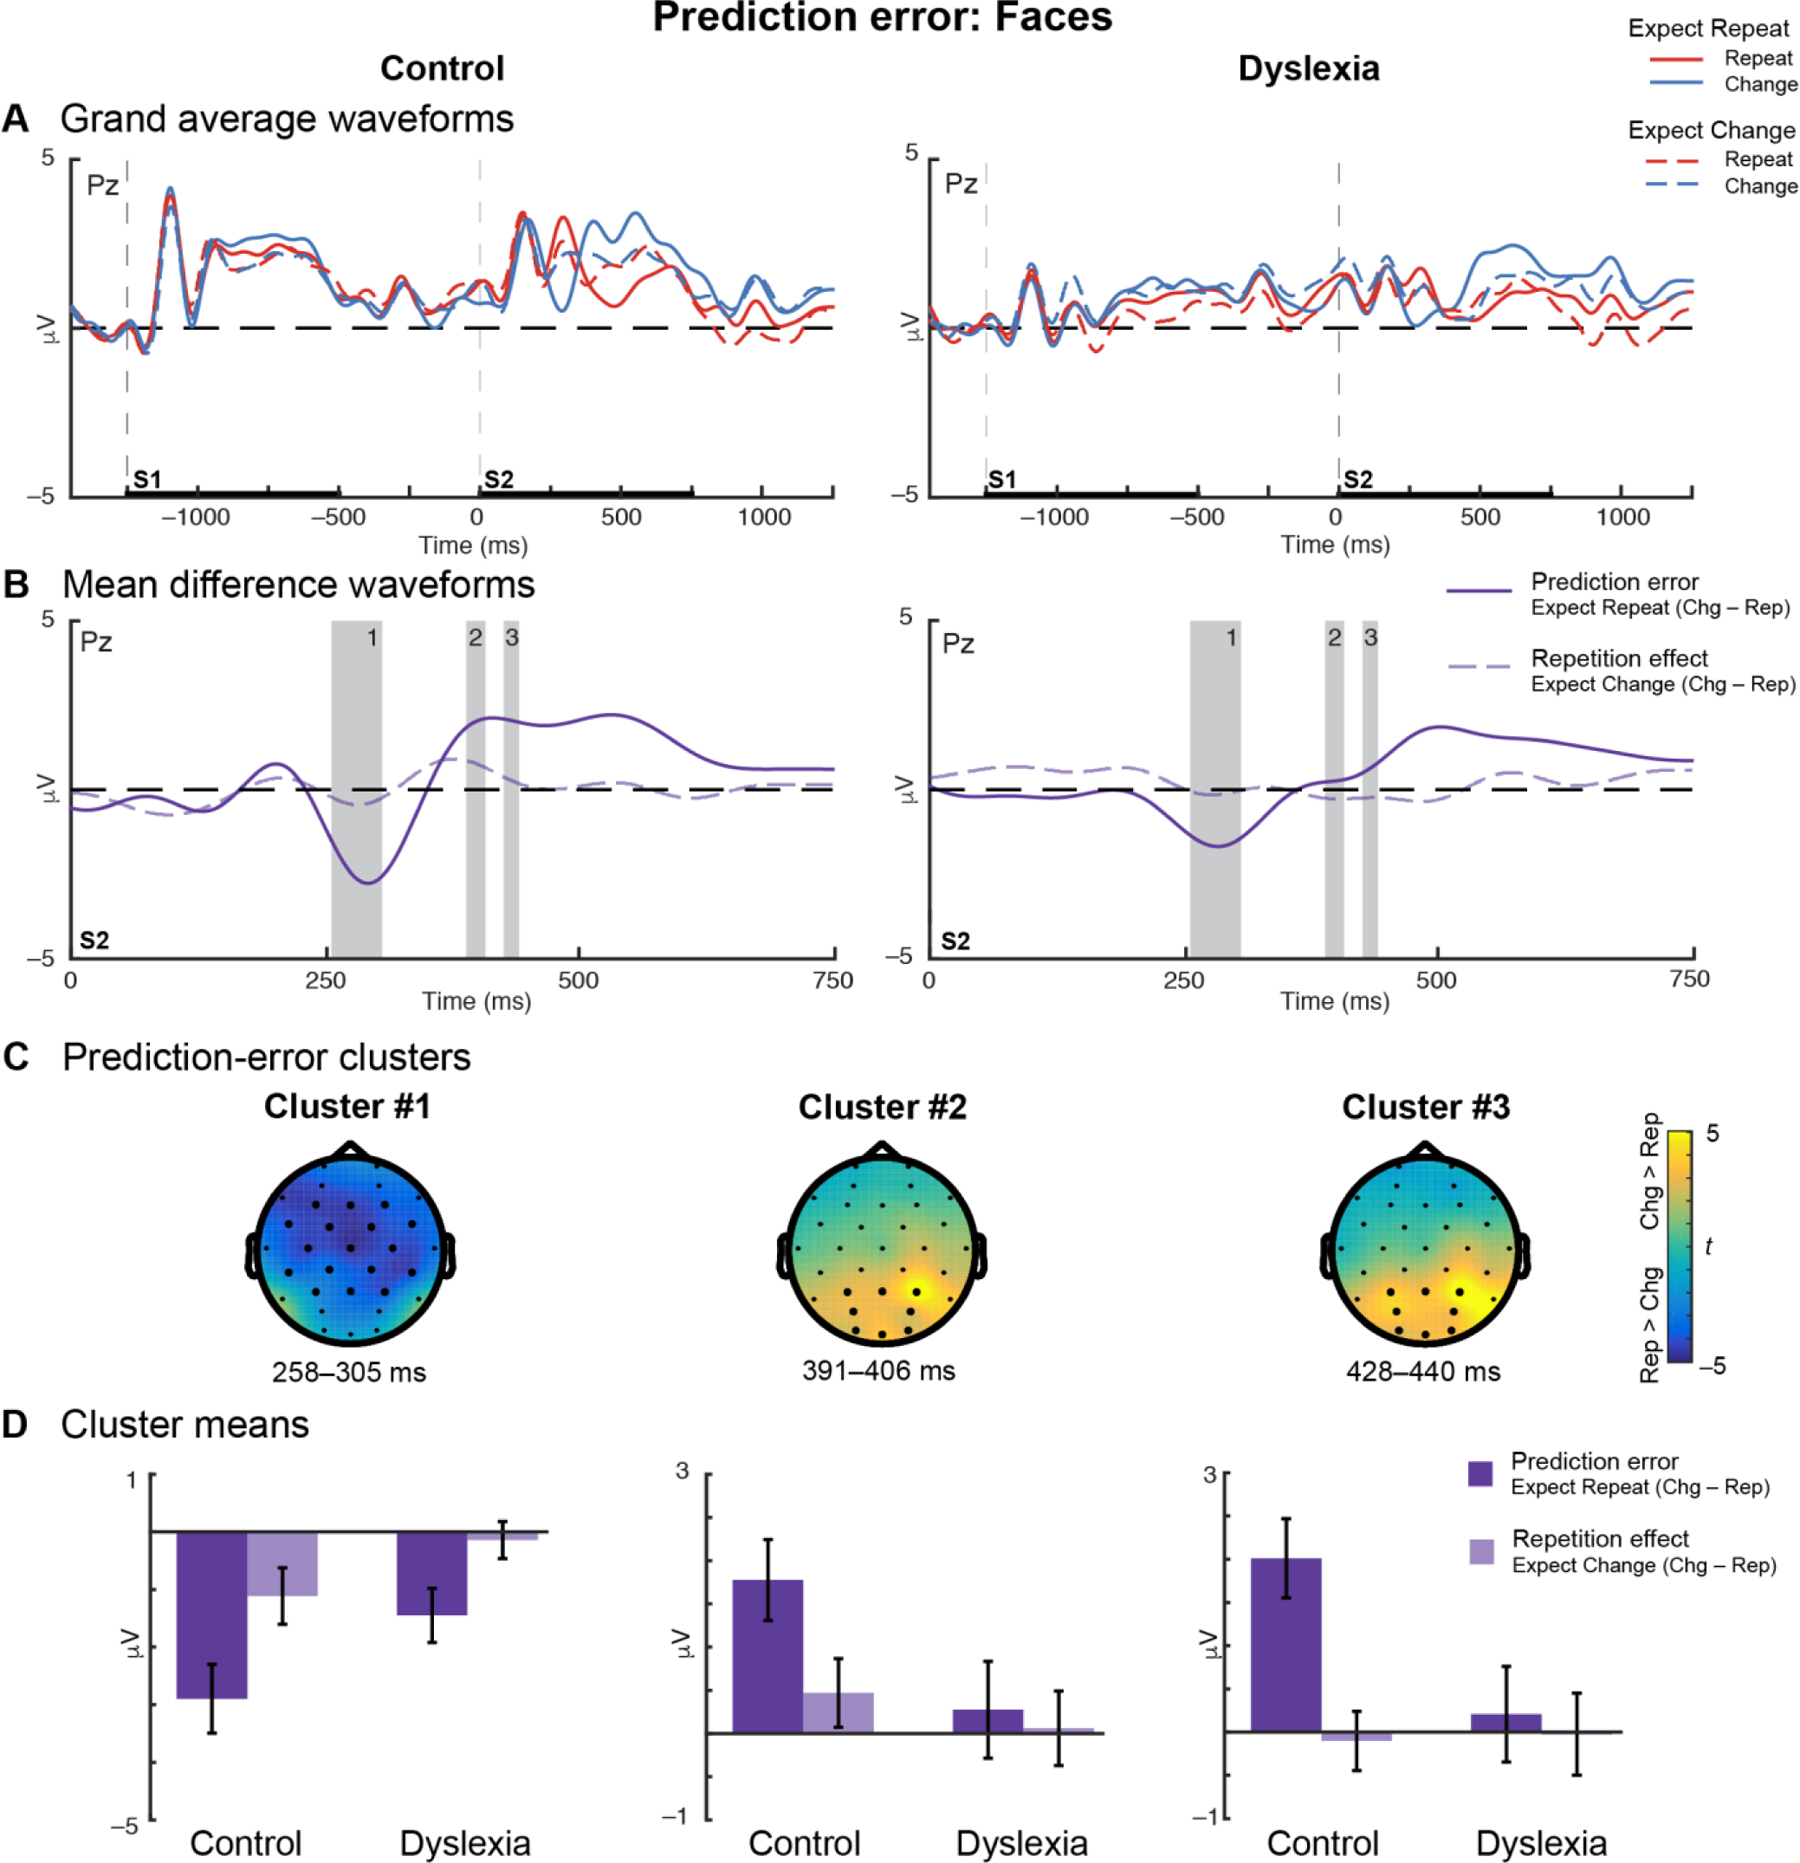
(A) Grand-average waveforms for Control (left) and Dyslexia (right) groups plotted at representative electrode Pz show that ERPs diverge during the during the second stimulus (S2) interval for Repetition (red) and Change (blue) trials under the expectation of repetition (solid lines) or of change (dashed lines). (B) Mean-difference waveforms for prediction error in the Expect Repeat condition (solid dark purple) and repetition in the Expect Change condition (dashed light purple) during S2 presentation. Control data are plotted on the left and Dyslexia on the right; gray bars on both indicate the durations of the prediction-error clusters identified in the Control group. (C) Topographical plots for each of the three prediction-error clusters identified in the Control group. Color indicates the prediction-error effect expressed as a t-statistic, averaged over the duration of the cluster. Dark electrodes significantly differentiate Change versus Repeat trials. (D) Mean-difference voltage values extracted from each cluster for Control and Dyslexia groups. Error bars represent (between-subjects) SEM. Overall, greater voltage differences are observed under the Expect Repeat condition than the Expect Change condition. In each cluster, prediction error is significantly or trends larger in Control versus Dyslexia.