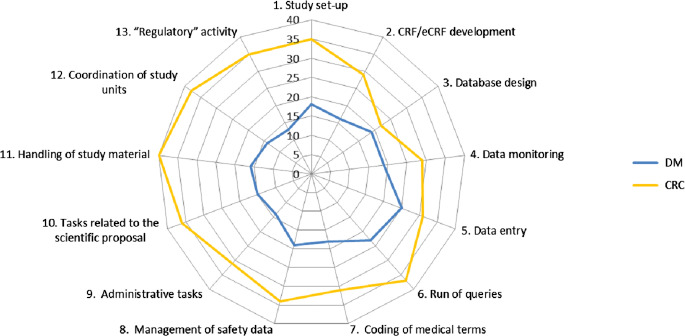
Fig. 2.
Polar plot representing the frequency with which each of the 13 activities at the centers is performed by the data managers (DM; blue line) or the clinical research coordinators (CRC; yellow line). The furthest lines are from the center, the most frequently activities are performed by the data managers or clinical research coordinator.

