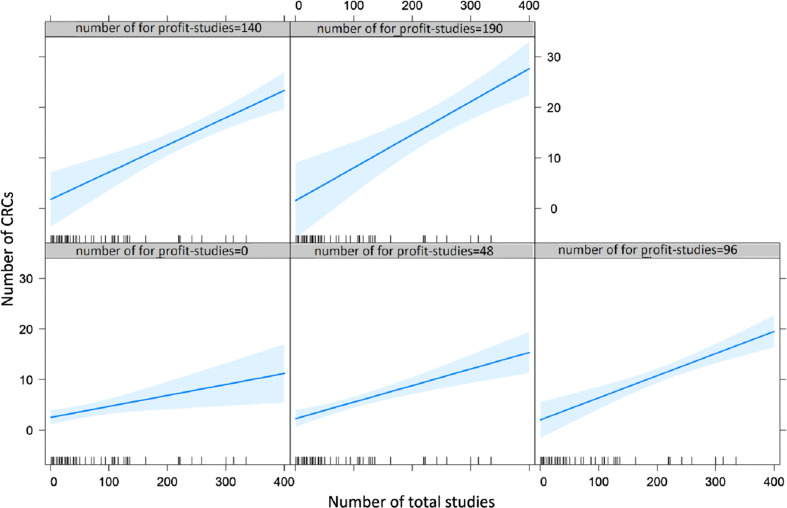
Fig. 3.
Plots representing the interaction between for-profit and overall studies on the number of clinical research coordinators (CRCs). Each plot depicts the relationship (regression line, and blue area as confidence intervals) between the number of total studies (X axis) and the number of CRCs (Y axis). The five plots are distinguished by the incremental number of for profit studies.

