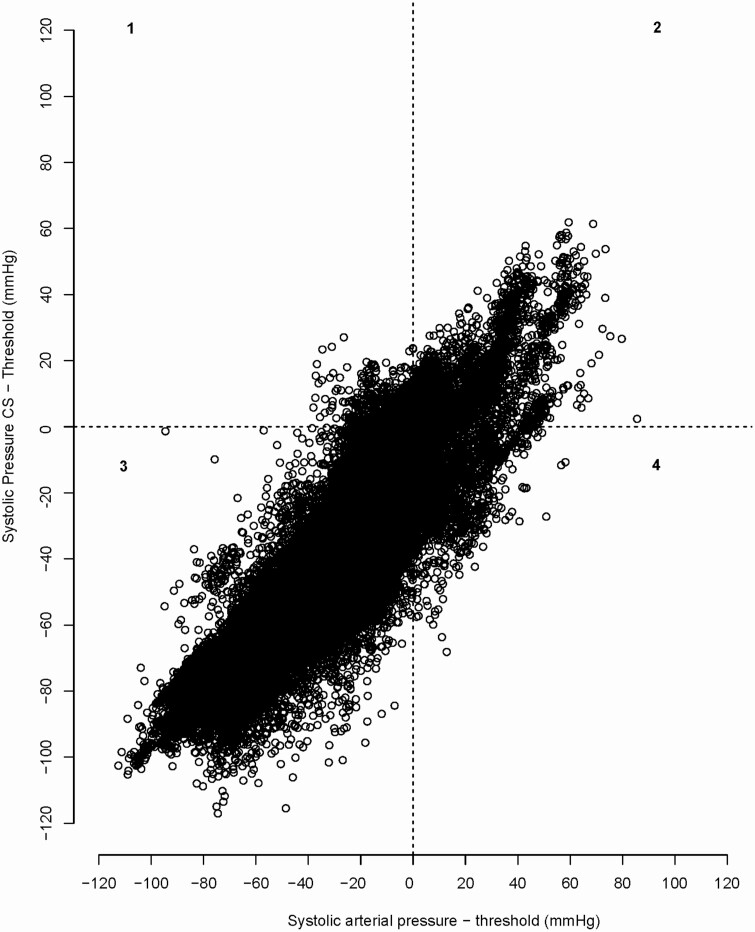
Figure 3.
Bland–Altman plot systolic arterial pressure BPCS and BPRAD with over- and undertreatment. Scatter plot with on the y-axis the difference between systolic BP by ClearSight compared to individual systolic threshold of patient (mm Hg). x-axis: the difference between systolic BP by radial artery cannula and individual systolic threshold. All potentially overtreatment when using Clearsight is plotted in upper left quadrant (1), and all potentially undertreatment when using ClearSight is presented in lower right square (4). Abbreviation: BP, blood pressure.

