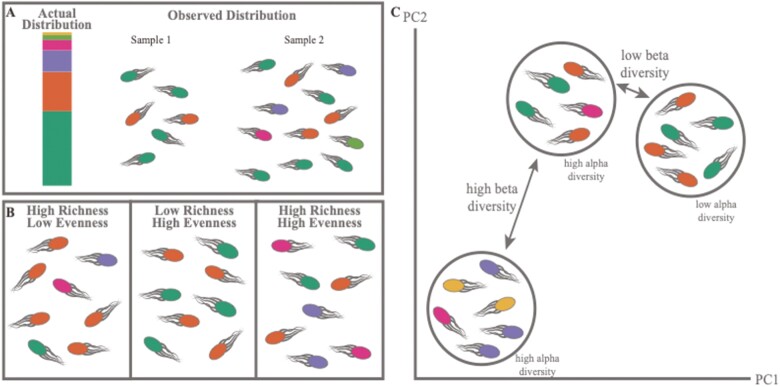
Figure 4.
Illustration of considerations for diversity analysis. (A) Example of differences in sample composition based on sampling depth showing that different sampling depths between samples within an experiment can lead to false differences in diversity. This demonstrates the importance of using a normalization method before diversity analysis. (B) Illustration of communities that represent different features included in diversity metrics, specifically the relationship between richness and evenness in how diversity is calculated. (C) Demonstration of the differences in alpha and beta diversity. Alpha diversity represents the diversity within a sample and could be similar even in samples with different taxonomic compositions. Beta diversity describes the differences between samples and can only be calculated by comparing communities. This also demonstrates how samples can have similar alpha diversities but different beta dissimilarities.

