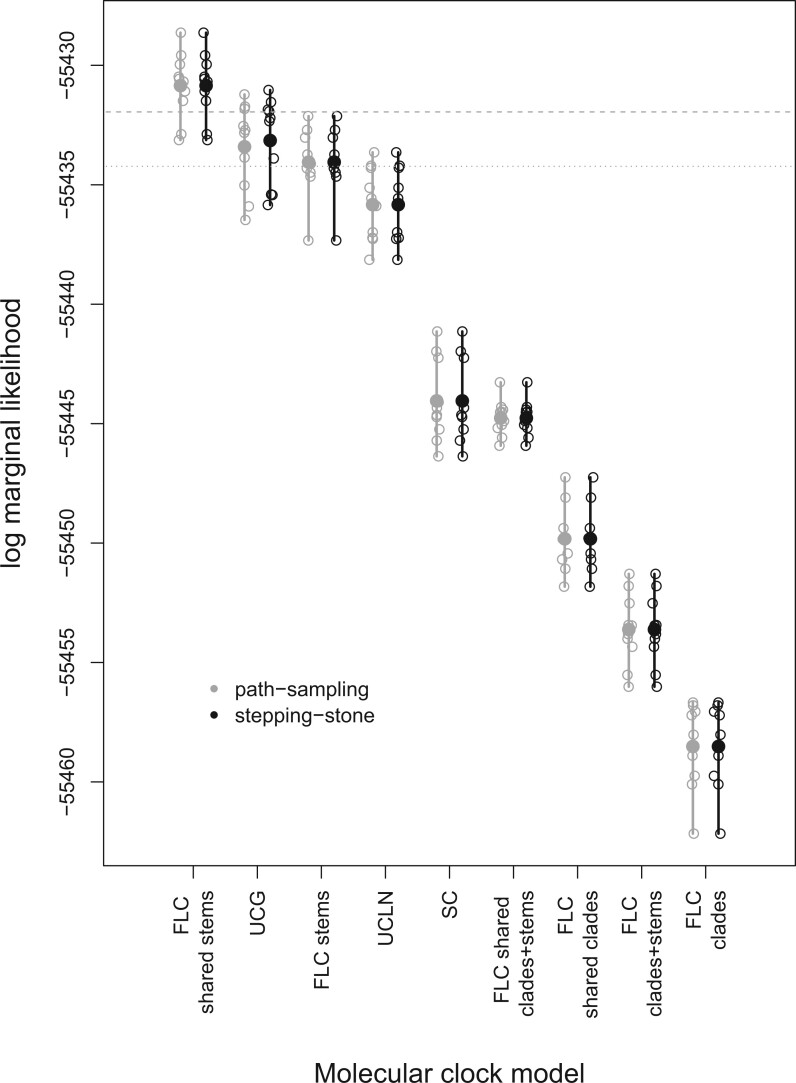
Fig. 1.
Calculations of log marginal likelihoods for all molecular clock models using path sampling and stepping-stone. The hollow circles represent individual estimates, with ten replicates per model, and solid circles denote the mean value over replicates. The vertical lines represent the range of values in each case. The horizontal dashed line corresponds to a log BF of 1.1 (“substantial evidence”) relative to the mean log marginal likelihood of the best model (FLC shared stems), whereas the dotted line is the same value relative to the lowest log marginal likelihood of the best model.

