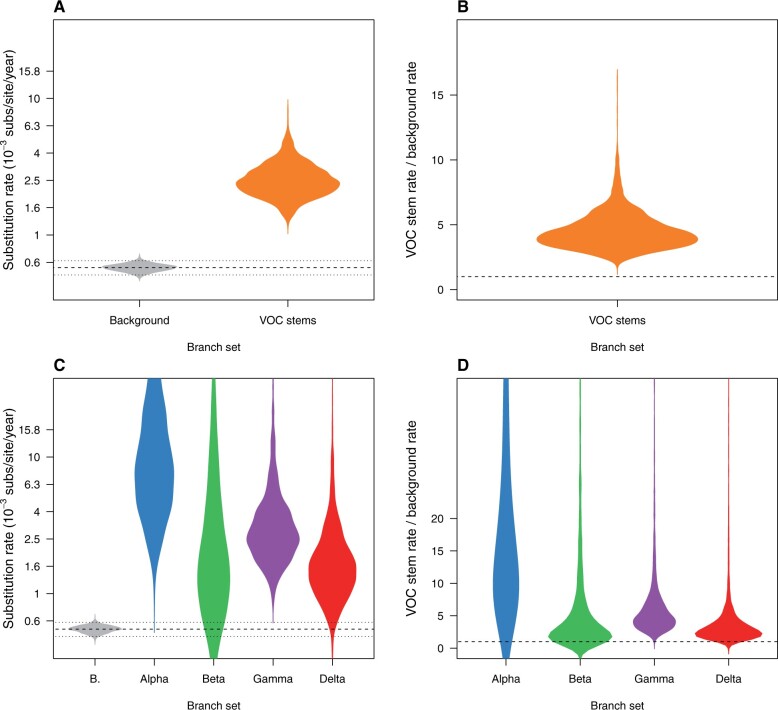
Fig. 2.
Violin plots for posterior statistics of FLC. (A) is for a model where the stem branches of VOCs share a substitution rate that is different to that of the background (model “FLC shared stems” in supplementary table S1 and fig. S1, Supplementary Material online). The substitution rate for VOCs stem branches is shown in orange and the background in gray. The dashed line represents the mean background rate and the dotted lines are the 95% credible interval. (B) is the ratio of the substitution rate for VOC stem branches and the background under the same model and the dashed line represents a value of 1.0 where the background and VOC stem rate would be the same. (C) and (D) show the corresponding statistics for the FLC stems model, where the stem branch of every VOC has a different rate. Abbreviation “B” stands for background.

