Fig. 3.
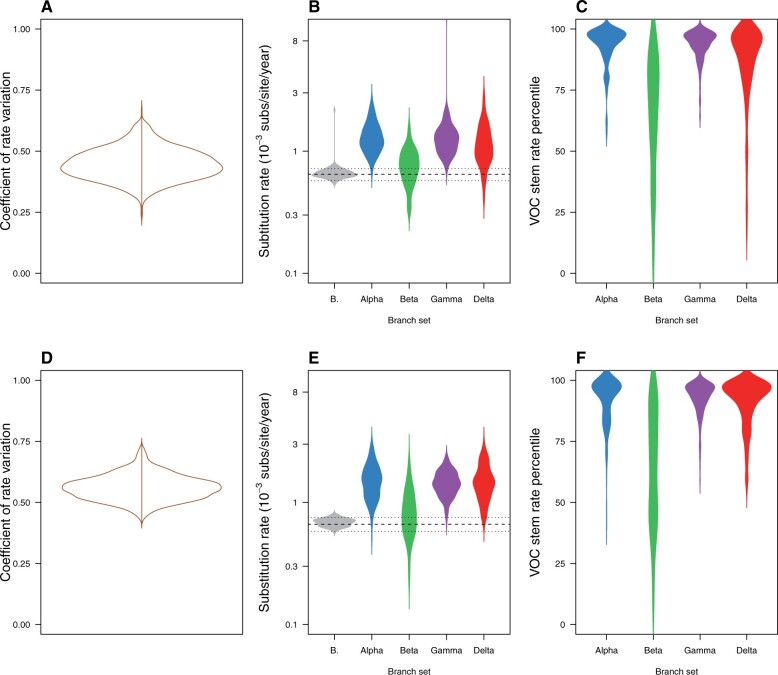
Violin plots of posterior statistics for the uncorrelated relaxed clocks with lognormal (UCLN) and gamma (UCG) distributions (see Supplementary Material online). The top row, (A) through (C), is for the UCLN and the bottom row, (D) through (F), is for the UCG. (A) and (D) show the coefficient of rate variation, which is the standard deviation of branch rates divided by the mean rate, and indicates clock-like behavior when it is abutting zero (Drummond et al. 2006; Ho et al. 2015). In (B) and (E), the substitution rate is shown for the stem branches of VOCs and for the mean of background branches (i.e., those that are not the stems of VOCs), abbreviated as “B.” The dashed line denotes the mean background rate, whereas the dotted lines represent the upper and lower 95% credible interval. (C) and (F) show the percentile in which stem branches for VOCs fall with respect to other branches. Note that the densities have been smoothed, but the maximum values are 100.

