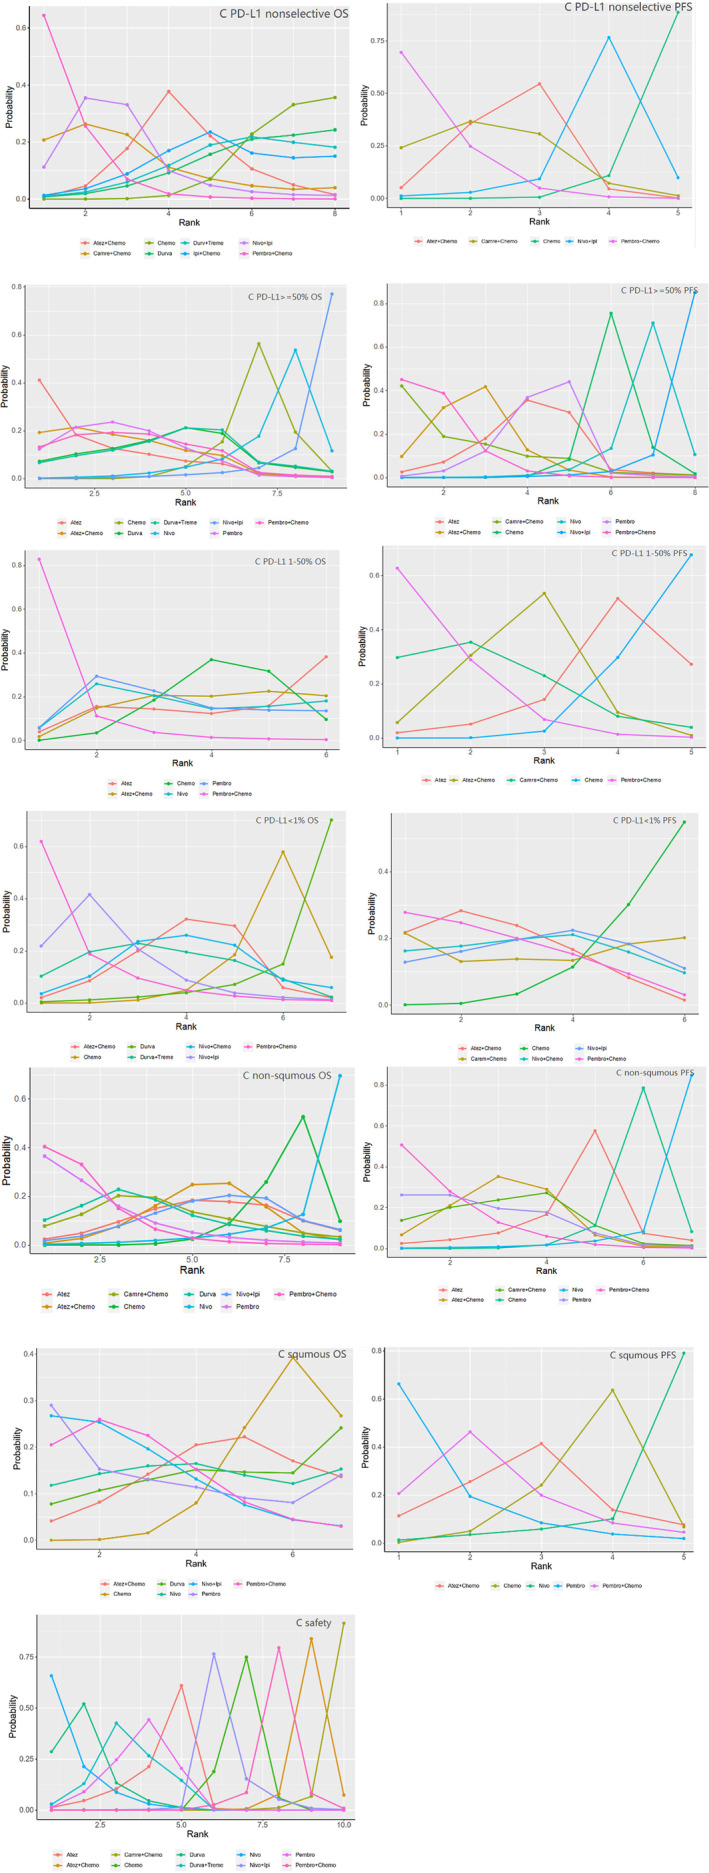
FIGURE 4.

Ranking plots of pooled mixed comparison, which show the probability of treatment agents to be ranked at first, second, third … and the last (all groups were included, for example, “C PD‐L1 nonselective OS” meant the OS analysis in all patients without PD‐L1 section, so as others)
