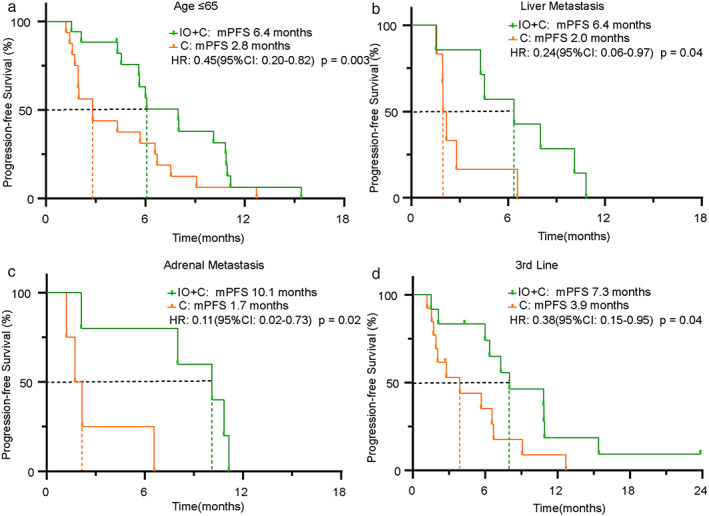
FIGURE 3.

Subgroup analysis of PFS between patients in the IO+C and C groups. (a) Age ≤ 65 subgroup. (b) Liver metastasis subgroup. (c) Adrenal metastasis subgroup. (d) Third‐line treatment subgroup

Subgroup analysis of PFS between patients in the IO+C and C groups. (a) Age ≤ 65 subgroup. (b) Liver metastasis subgroup. (c) Adrenal metastasis subgroup. (d) Third‐line treatment subgroup