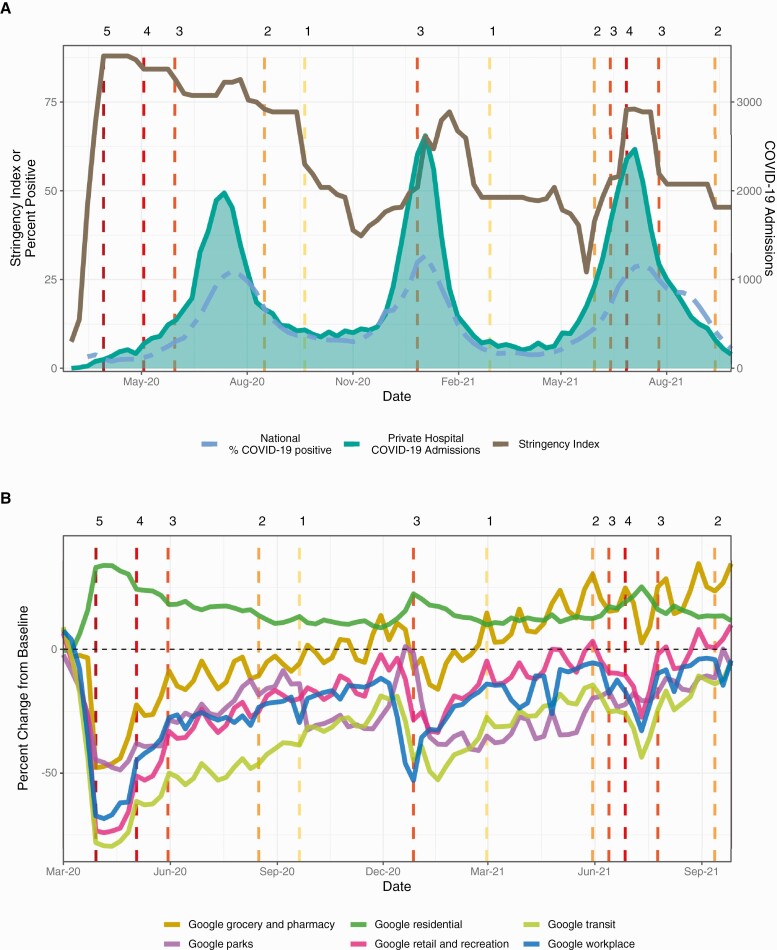
Figure 1.
The stringency of government responses to coronavirus disease 2019 (COVID-19) and mobility metrics for South Africa from March 2020 to September 2021. Vertical dashed lines indicate lockdown alert levels (Table 1) and are colored by the stringency of lockdown measures: dark to light. A, Weekly time series for the national percentage of positive COVID-19 tests (dashed line), the number of COVID-19–coded admissions in South Africa’s primary private hospital group, and the Oxford policy stringency index for South Africa. B, The weekly percent change from baseline for 6 Google mobility categories.

