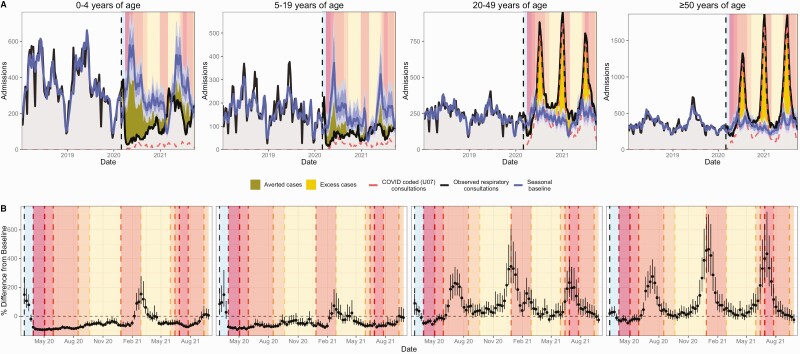
Figure 3.
All-cause respiratory admissions in all age groups. A, Weekly all-cause respiratory admissions by age group relative to all-cause respiratory admissions expected in the absence of COVID-19. The band is the 95% prediction interval of the projected seasonal baseline. The dashed line is the number of COVID-coded encounters. The vertical dashed line indicates the start of the model prediction period (1 March 2020), and panel colors indicate the pre-lockdown period (1 March 2020–26 March 2020) and lockdown alert levels from March 2020 to September 2021 (Table 1). Panels are shaded according to the stringency of lockdown measures: dark to light. The area between the projected seasonal baseline and observed consultations has dark shading when observed consultations are below baseline (“averted cases”) and light shading when observed consultations are above baseline (“excess cases”). B, Weekly observed percent difference from seasonal baseline (95% confidence interval) by age group. Abbreviation: COVID-19, coronavirus disease 2019.

