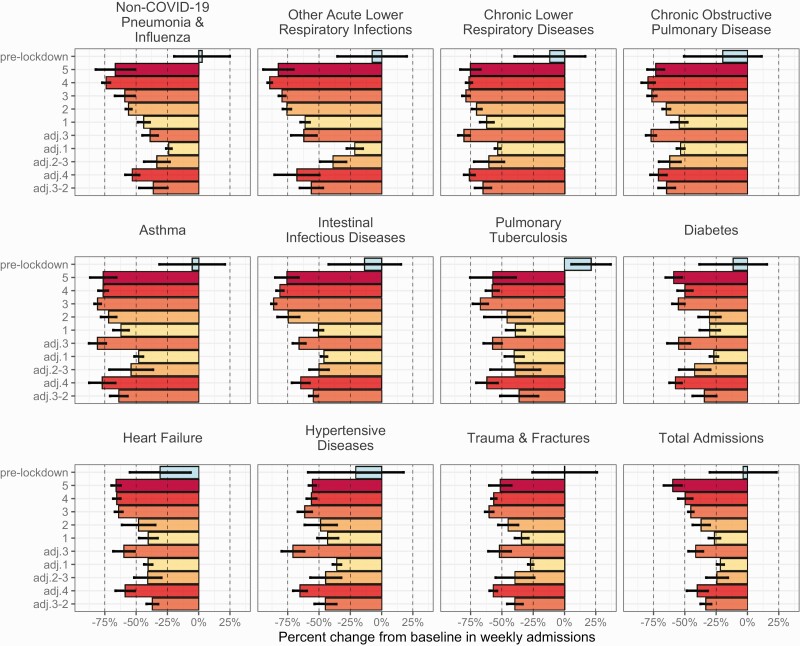
Figure 4.
Percent change in inpatient admissions for total admissions and non–COVID-19 diagnoses relative to baseline numbers expected in the absence of COVID-19. The average percent change from baseline in weekly admissions during 10 phases of the COVID-19 pandemic in South Africa: pre-lockdown (1 March 2020–26 March 2020) and lockdown alert levels from March 2020 to September 2021 (Table 1). Bars are shaded according to the stringency of lockdown measures: dark to light. The vertical dashed line indicates a 50% reduction relative to the projected baseline number of admissions. See Supplementary Figure 11 for plots of all diagnosis groupings analyzed in the study. Abbreviation: COVID-19, coronavirus disease 2019.

