
Fig. 2.
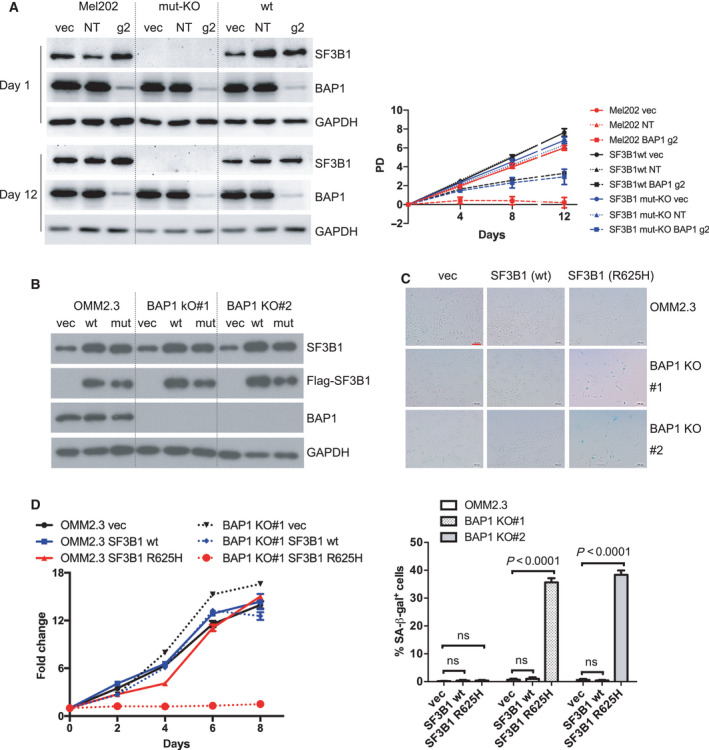
BAP1 deficiency combined with SF3B1 hotspot mutation induces senescence. (A) Growth curve of Mel202 cells with different SF3B1 mutation status infected by vector control (vec), non‐targeting sgRNA (NT), or BAP1‐targeting g2 sgRNA. Mel202 cells harbor heterozygous SF3B1 mutation, SF3B1 mut‐KO Mel202 cells contain out‐frame deletion of the mutant allele and p. His8_Glu9delinsGln in the wild‐type allele, and SF3B1 wt indicates re‐expression of the wild‐type SF3B1 in the SF3B1 mut‐KO cells. The data are presented as the mean ± SD (n = 3) from one representative experiment out of three. (B) Re‐expression of Flag‐tagged wt or mutant SF3B1 (R625H) in OMM2.3 and BAP1 KO clones. The blots shown are representative of three independent experiments. (C) Images show acidic senescence‐associated β‐galactosidase staining. The scale bar represents 100 μm. Graph represents the percentage of β‐galactosidase‐positive cells versus total cells (at least 200 cells were counted in random fields per group). The data are presented as the mean ± SD (n = 3) from one representative experiment out of three. One‐way ANOVA followed by Tukey test was used for statistical analysis. (D) Growth curve of OMM2.3 (solid lines) and OMM2.3 BAP1 KO#1 clone (dashed lines) infected with retrovirus encoding for wt or mutant SF3B1 (R625H). The data are presented as the mean ± SD (n = 6) from one representative experiment out of three.