
Fig. 5.
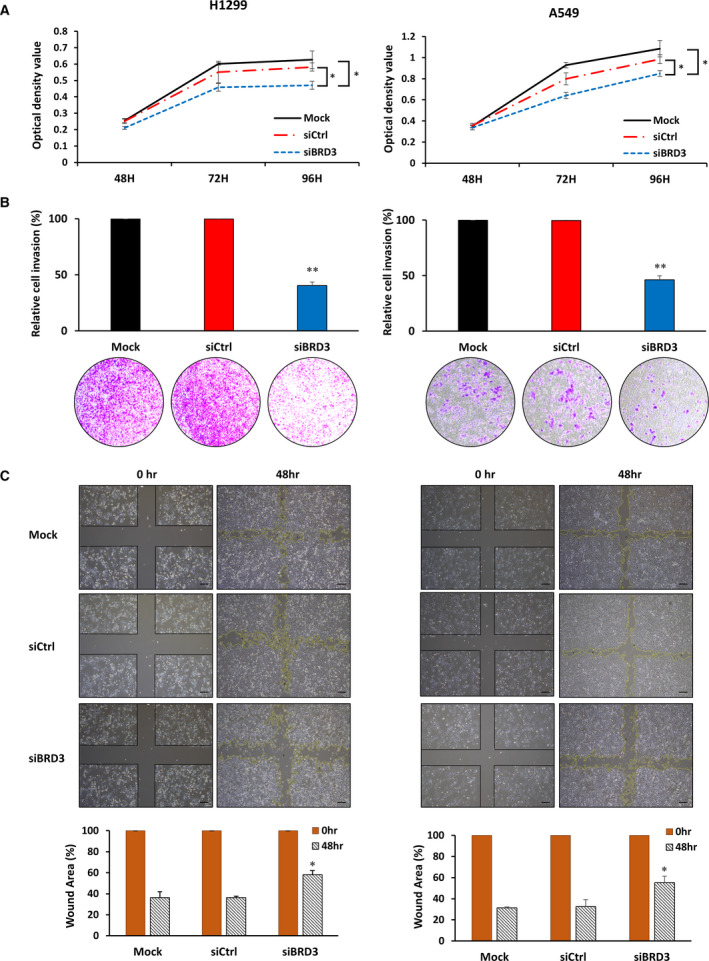
Effects of BRD3 silencing on H1299 and A549 cells. (A) Cell viability as evaluated by an MTT assay (n = 3); siRNA was applied 24 h after cell seeding. (B) After transfection with Mock, siRNA control (siCtrl), and siBRD3, the cell invasion ability of H1299 and A549 cells was assessed using a Transwell invasion assay. The number of Mock cells was set to 100%. Representative images from 3 experiments are shown below the graph. (C) A wound‐healing assay (n = 4) was performed to detect the migration of cells. Upper: representative photographs of controls and siBRD3‐treated H1299 and A549 cells in the wound‐healing assay. Scale bar: 100um. Lower: percentage of wound area as determined in imagej by the rate of cells moving toward the scratched area over a given period. P values are derived from comparisons with the Mock control group. Data are presented as mean ± SEM and two‐tailed Student's t‐test was used to calculate the statistical significance: *P < 0.01, **P < 0.001.