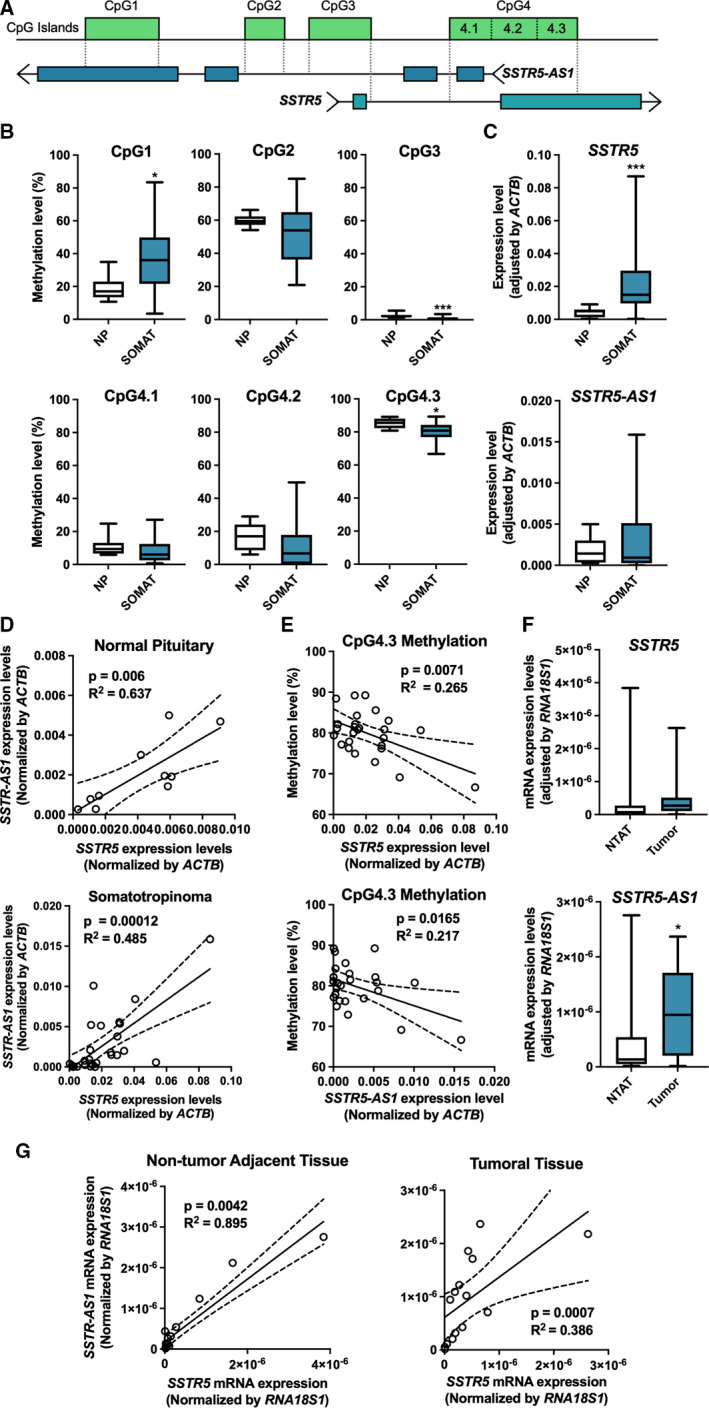
Fig. 1.

Expression of SSTR5 is regulated by DNA methylation and NAT. (A) Cartoon representation of SSTR5‐AS1 and SSTR5 loci, based on Genome Browser information. (B) Comparison of methylation levels between somatotropinoma (SOMAT) and normal pituitary (NP) samples, expressed as percentage, under t test. (C) Expression levels of SSTR5 and SSTR5‐AS1 (t test) and (D) correlations (Pearson correlation) between them in somatotropinomas and NPs, measured by qPCR and normalized by ACTB. (E) Correlations (Pearson correlation) between methylation levels of CpG4.3 and expression levels of SSTR5 and SSTR5‐AS1 in somatotropinoma samples. (F) Expression levels of SSTR5 and SSTR5‐AS1 (Mann–Whitney U test) and (G) correlations (Spearman correlation) between them in PanNETs and nontumor adjacent tissue (NTAT), measured by qPCR and normalized by RNA18S1. Asterisks (*P < 0.05; ***P < 0.001) indicate values that significantly differ from control. In all cases, data represent median and interquartile range of 27 somatotropinomas, 11 NPs and 15 PanNETs with their NTAT.
