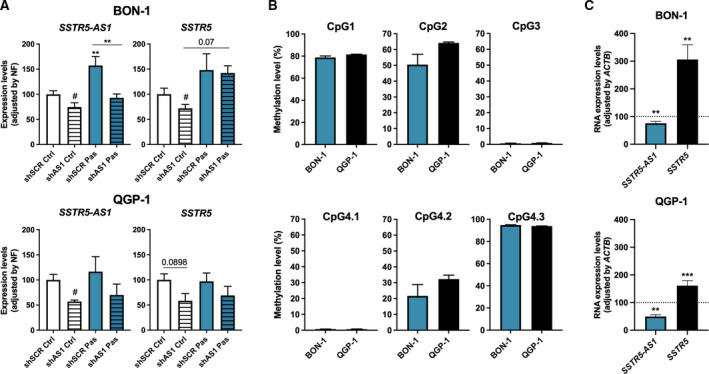
Fig. 2.

Interrelation of SSTR5‐AS1 and SSTR5 expression and regulation by 5‐azacytidine. (A) Expression levels of SSTR5‐AS1 and SSTR5 were evaluated in BON‐1 and QGP‐1 cell lines after SSTR5‐AS1 silencing (striped bars) and 24‐h treatment with pasireotide 100 nm (Pas, blue), and were measured by qPCR, and adjusted by normalization factor (NF) with ACTB, GAPDH and HPRT housekeeping genes. (B) Basal methylation levels of BON‐1 and QGP‐1 in SSTR5 and SSTR5‐AS1 loci, expressed as percentage. (C) RNA expression of SSTR5‐AS1 and SSTR5 after treatment with 5‐azacytidine demethylase. Asterisks (**P < 0.01; ***P < 0.001) indicate values that significantly differ between groups under one‐way ANOVA; # symbol indicates values that significantly differ from control under t test. In all cases, data represent mean ± SEM of n = 3 and five independent experiments for BON‐1 and QGP‐1, respectively.
