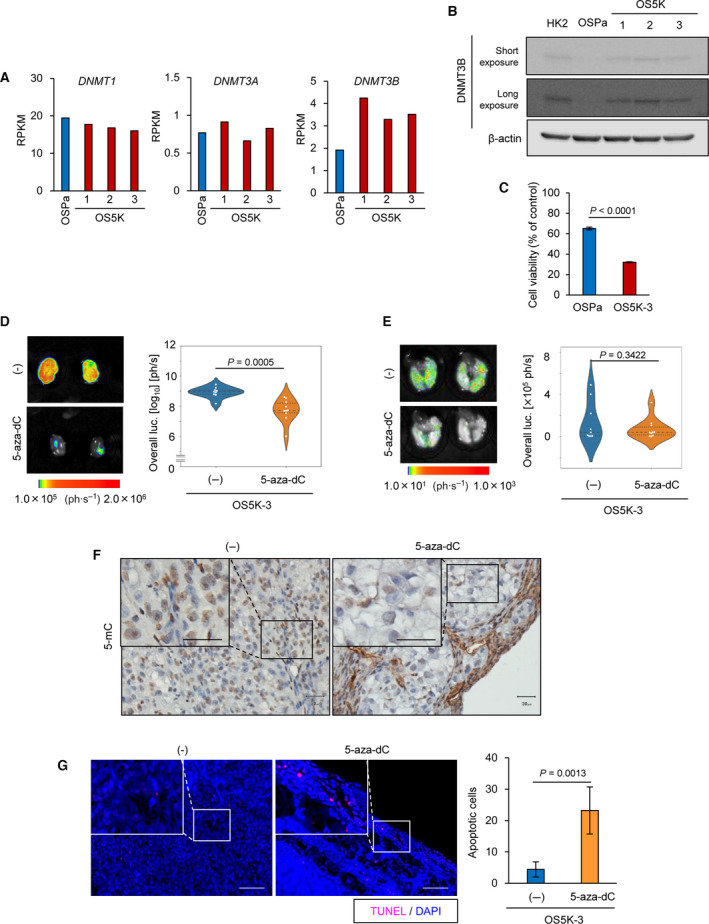
Fig. 1.

Inhibition of DNMT induces apoptosis of highly malignant ccRCC cells. (A) Expression of DNMT in OS‐RC‐2 derivatives. DNMT mRNA were re‐analyzed by RNA‐seq analysis (GSE131137). The expression of DNMT is shown with reads per kilobase of exon per million mapped reads (RPKM) (n = 1 sample). (B) Immunoblotting of DNMT3B and β‐actin expression in OS‐RC‐2 derivatives. Representative data from three independent experiments are shown. (C) Cell proliferation assay of OS‐RC‐2 derivatives. The cells were treated with 5‐aza‐dC (1 µm) for 8 days. The percentages compared with untreated control of each cell are indicated. The bars represent the mean ± SD (two‐sided Student’s t‐test; n = 3 each). (D,E) Ex vivo bioluminescence imaging of primary (D) and metastatic lung (E) tumors (left) and quantification (right). OS5K‐3 cells were pretreated with or without 5‐aza‐dC (0.1 µm) for 72 h and inoculated orthotopically in mice. Mice bearing OS‐RC‐2 derivatives were analyzed 17 days after orthotopic inoculation. The bars represent the mean and 1st and 3rd quartiles (D: two‐sided Welch’s t‐test; (E) two‐sided Student’s t‐test; n = 9, control (‐) mice; n = 10, 5‐aza‐dC mice). (F) Immunohistochemical staining of the primary tumor tissues in (D) with 5‐methylcytosine (mC). The 5‐mC staining in the boxed region is shown at high magnification. Scale bars: 30 µm. (G) TUNEL assay of the primary tumor tissues in (D) representative images (left) and the number of apoptotic cells in the independent fields (right) are shown. The nucleus was stained with DAPI. Scale bars: 100 µm. The bars represent the mean ± SD (two‐sided Student’s t‐test; n = 5 each).
