
Fig. 3.
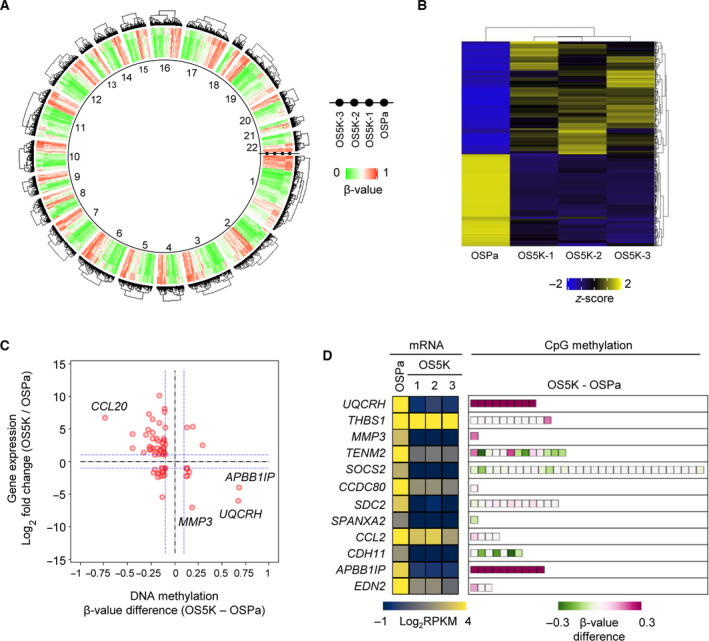
Integrative analysis of ccRCC derivatives using gene expression and DNA methylation in OS‐RC‐2 derivatives. (A) Methylation status as determined by methylation array. Heatmap shows the β‐value of the CpG loci in the promoter DNA in each cell. Clustering was performed on each chromosome (n = 2). (B) Gene expression profile using RNA‐seq analysis (GSE131137). Genes whose expression was altered in OS5K cells were screened based on reads per kilobase of exon per million mapped reads [RPKM > 3 in either OSPa or OS5K cells and | Log2 (RPKM in OS5K/RPKM in OSPa) | > 1]. The z‐score was then calculated using RPKM in each gene. Each gene expression profile was applied to hierarchical clustering. (n = 1). (C) Correlation between DNA methylation and gene expression. Genes were screened by gene expression [RPKM in B, | Log2 (RPKM in OS5K/RPKM in OSPa) | > 1] and DNA methylation score (β‐value in A, | β‐value difference | > 0.1). The blue horizontal lines correspond to changes in gene expression more than twice, whereas the blue vertical lines correspond to an absolute difference in β‐value of more than 0.1. (D) Methylation status of the downregulated genes. The significantly decreased genes in OS5K cells were screened and compared with those in OSPa cells in (B) and the methylation status then examined. Boxes represent the probes in their promoter CpG loci in (A). Heatmap shows the gene expression in each cell or the β‐value difference between OS5K and OSPa cells in each promoter CpG locus.