
Fig. 5.
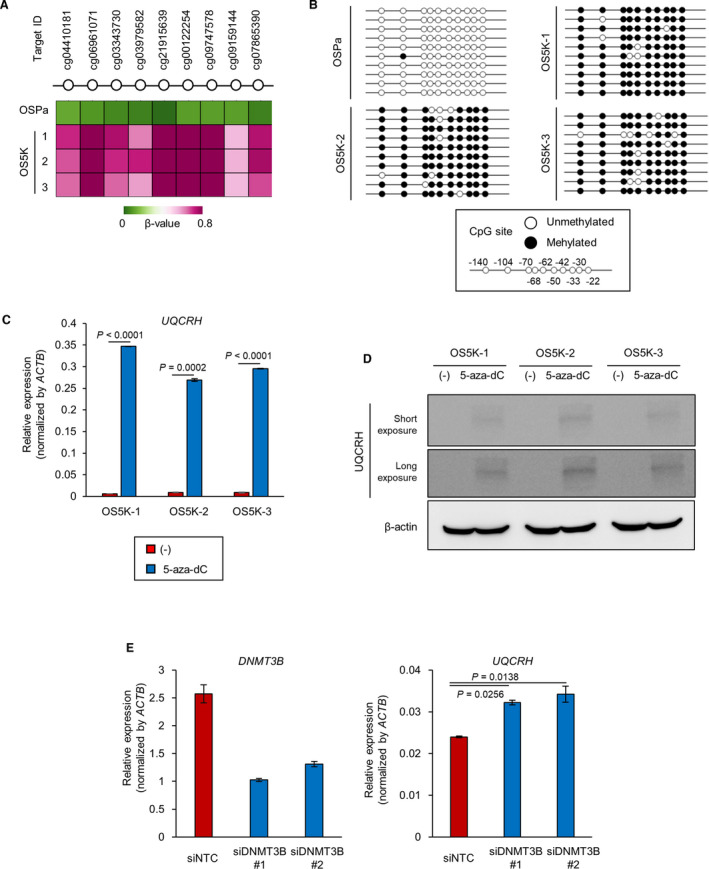
UQCRH expression is downregulated by DNA methylation. (A) Analysis of the methylation status of the UQCRH promoter region in OSPa, OS5K‐1, OS5K‐2 and OS5K‐3 cells using the data set from the methylation array in Fig. 3A . Heatmap shows the β‐value. (B) Bisulfite‐sequencing analysis of the UQCRH promoter region in OSPa, OS5K‐1, OS5K‐2 and OS5K‐3 cells. Black circles mark the methylated CpG loci; white, unmethylated (n = 10, OSPa; n = 10, OS5K‐1; n = 10, OS5K‐2; and n = 9, OS5K‐3). (C,D) Upregulation of UQCRH in OS‐RC‐2 derivatives by the inhibition of DNMT. OS5K cells were cultured with or without 5‐aza‐dC (0.3 µm) for 96 h. UQCRH mRNA was analyzed by qRT‐PCR analysis (C). The bars represent the mean ± SD (two‐sided Student’s t‐test; n = 2). Representative data from three independent experiments are shown. UQCRH protein and β‐actin protein were detected using immunoblotting (D). (E) Upregulation of UQCRH in OS5K‐3 cells by silencing of DNMT3B. OS5K‐3 cells were transfected with control siRNA (siNTC) or siRNA targeting DNMT3B (siDNMT3B#1 and #2). After 72 h, gene expression of DNMT3B and UQCRH was analyzed by qRT‐PCR analysis. The bars represent the mean ± SD (one‐way ANOVA and Dunnett’s test; n = 2). Representative data from three independent experiments are shown.