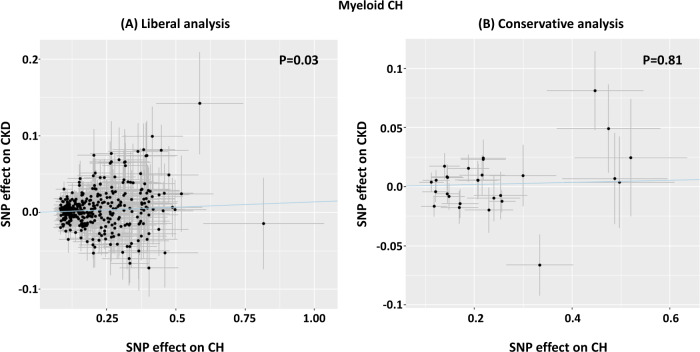
Fig. 3. Mendelian randomisation using robust adjusted profile score (MR-RAPS) to estimate the effect of SNPs associated with CH against their effect in relation to CKD.
A Liberal analysis using 380 independent SNPs associated with CH at P < 0.001. The MR-RAPS test estimated a significant positive effect of CH on CKD (OR = 1.014, CI 95%:1.003–1.024; P = 0.03). B Conservative analysis using 28 SNPs associated with CH at P < 1 × 10⁻⁵. The line of regression is indicated in blue and the axes show β coefficients for SNP effects on CH and CKD.

