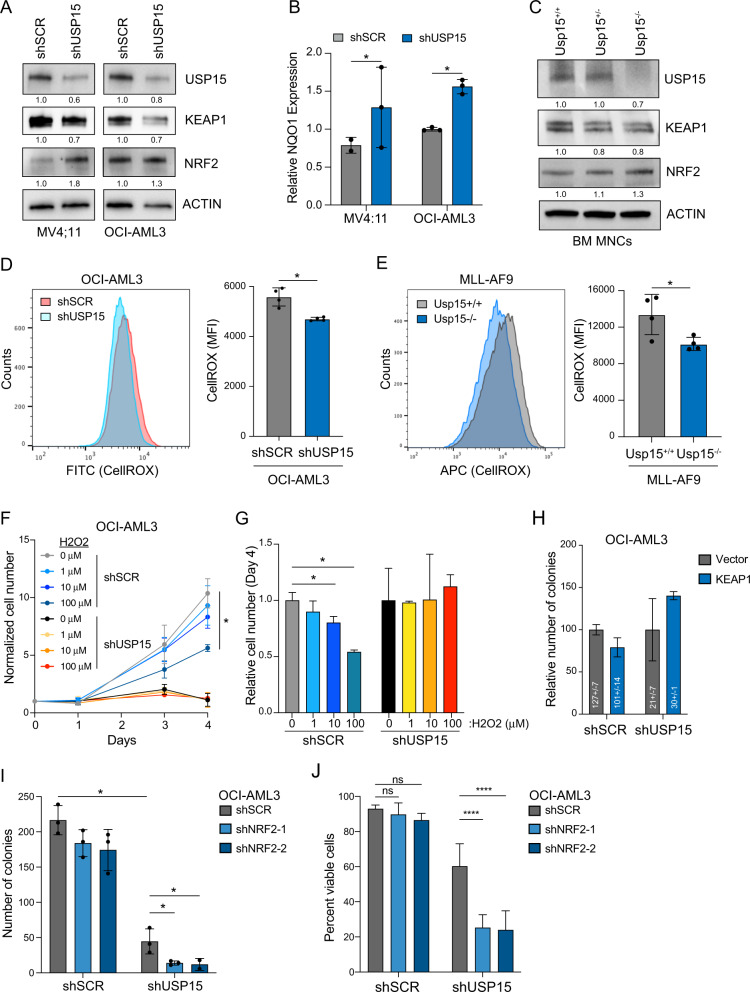
Fig. 5. Inhibition of USP15 activates NRF2 and affects cellular ROS.
A Immunoblot analysis of USP15, KEAP1, NRF2, and ACTIN in the indicated AML cells transduced with shRNAs targeting USP15 (shUSP15) or a scrambled control shRNA (shSCR). Values below blots represent the relative quantity of bands. Data reflects three independent assays. B Relative mRNA expression of the NRF2 target gene, NQO1, in the indicated AML cells transduced with shRNAs targeting USP15 (shUSP15) or a scrambled control shRNA (shSCR). Values were normalized to the shSCR controls for each (n = 3 replicates per group). C Immunoblot analysis of USP15, KEAP1, NRF2, and ACTIN in BM mononuclear cells isolated from Usp15+/+, Usp15+/−, and Usp15−/− mice. Data reflects three independent assays. D Left: a representative histogram of CellROX-Green intensity, indicative of cellular ROS, measured in OCI-AML3 cells transduced with shRNAs targeting USP15 (shUSP15) or a scrambled control shRNA (shSCR); right: bar graph of the median fluorescent intensity of CellROX (FITC) observed from OCI-AML3 cells transduced with shRNAs targeting USP15 (shUSP15) or a scrambled control shRNA (shSCR) (n = 4 per group). Data reflects two independent assays. E Left; a representative histogram of CellRox-Deep Red intensity, indicative of cellular ROS in Usp15+/+ and Usp15−/− cells expressing MLL-AF9; Right: summary of the median fluorescent intensity of CellROX-Deep Red, indicative of cellular ROS in MLL-AF9;Usp15+/+ and MLL-AF9;Usp15−/− AML cells (n = 4 per group). Representative data from 2 replicate experiments. F Cell growth of OCI-AML3 cells transduced with shRNAs targeting USP15 (shUSP15) or a scrambled control shRNA (shSCR) normalized to the live cells plated at Day 0. Cells were cultured in media supplemented with the indicated concentration of hydrogen peroxide (H2O2). Representative data from 2 replicate experiments (n = 3 for shSCR; n = 2 for shUSP15). G Summary of the live cell number on day 4 of OCI-AML3 cells expressing shRNAs targeting USP15 (shUSP15) or a scrambled control shRNA (shSCR) treated with the indicated concentration of H202. The relative cell number was normalized to the cells treated with vehicle control (water; 0 μM). *P < 0.05 (n = 3 per group). H Number of colonies from OCI-AML3 lines expressing empty-vector or overexpressing KEAP1, with and without knockdown of USP15. Colony counts were normalized to the vector controls within each shRNA group. Numbers within the histogram show actual colony numbers for each group (n = 3 per group). I Total number of colonies formed by OCI-AML3 cell lines expressing shRNAs targeting USP15 (shUSP15) or a scrambled control shRNA (shSCR) that were subsequently transduced with shRNAs targeting NRF2. *P < 0.05 (n = 3 per group). Data reflects two independent assays. J Cell viability of OCI-AML3 cells from panel (I) at the termination of a 4-day growth curve in liquid culture. ****P < 0.0001; two-way ANOVA. (n = 4 per group).

