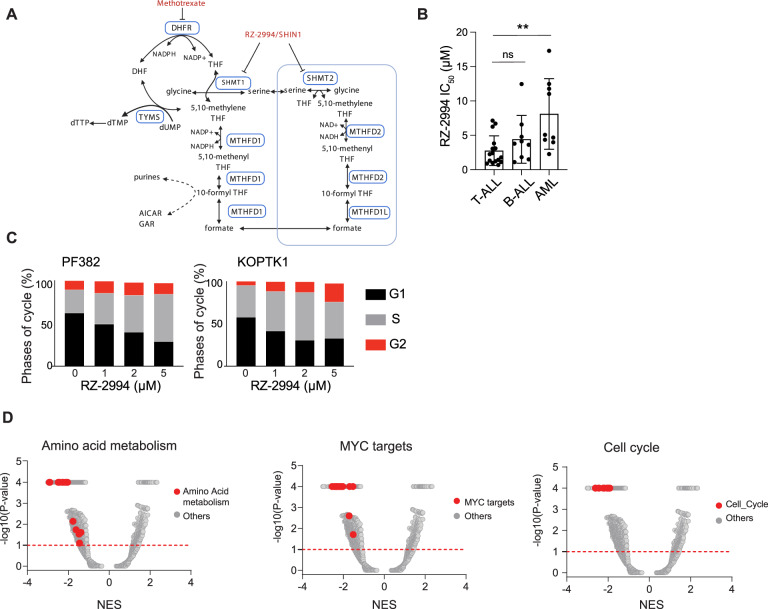
Fig. 3. Enzymatic inhibition of SHMT1 and SHMT2 results in T-ALL arrest and gene expression changes.
A Simplified schematic of the one-carbon folate pathway highlighting the targets for RZ-2994 and methotrexate. B T-ALL (n = 16), B-ALL (n = 9), and AML (n = 9) cell lines were treated with RZ-2994 in a range of concentrations, in quadruplicate for 6 days. Bar graph showing the average IC50 per lineage, with each dot representing the IC50 in a cell line. **P ≤ 0.01 using one-way ANOVA with post hoc multiple comparisons test. C Cell cycle analysis in T-ALL cells treated with increasing concentrations of RZ-2994. D RNAseq was performed for the KOPTK1 cell line treated with RZ-2994. Volcano plots showing quantitative comparison of gene sets from MSigDB v7.0 using ssGSEA. Volcano plots compare DMSO versus RZ-2994 after 3 days of treatment. All data sets above the dashed red line have P value ≤ 0.05.

