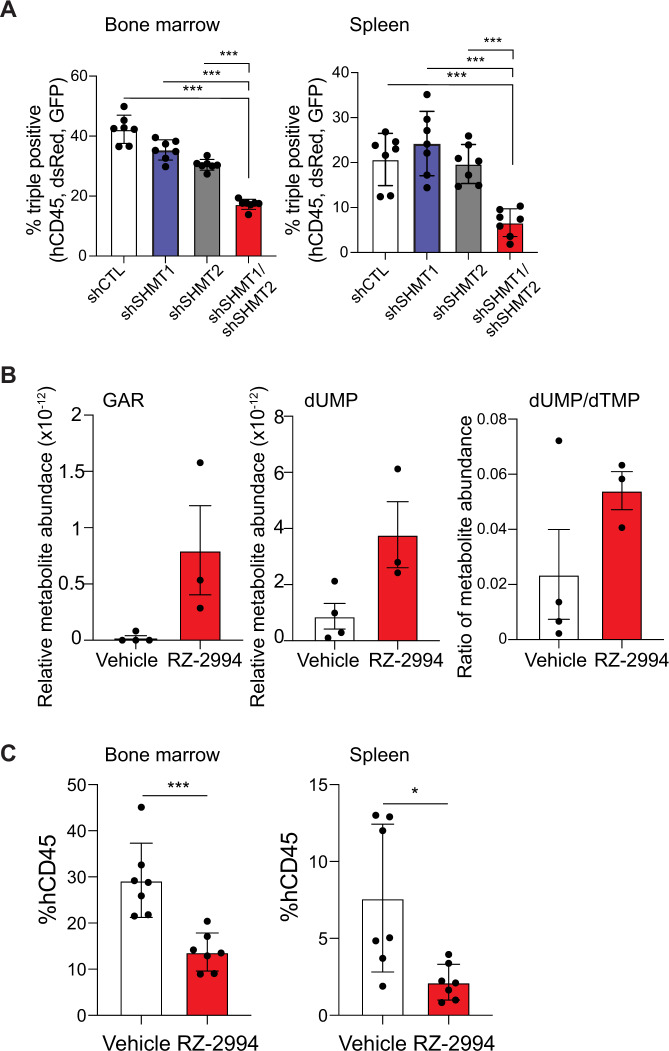
Fig. 6. Knockdown and enzymatic inhibition of SHMT1 and SHMT2 are effective for T-ALL therapy in vivo.
A Bar graph depicting percent of triple positive (hCD45+, GFP+, and dsRed+) cells in bone marrow and spleen. Shown is average with SD, n = 7 per group. *P ≤ 0.05; ***P ≤ 0.001 using Mann–Whitney test. B Polar metabolites were extracted from spleens of mice treated with RZ-2994 for 1 week and targeted profiling done using LC–MS. Bar graph shows relative metabolites compared to internal controls. Shown is average with SD, n = 4 for vehicle samples, and n = 3 for RZ-2994 samples. C Irradiated NSG mice were injected with RPMI8402-lucNeo cells. After disease was established, mice were treated with RZ-2994. Bar graph showing percent of hCD45+ cells in bone marrow and spleen after treatment with RZ-2994 100 mg/kg daily for 2 weeks. *P ≤ 0.05; ***P ≤ 0.001 using Mann–Whitney test.

