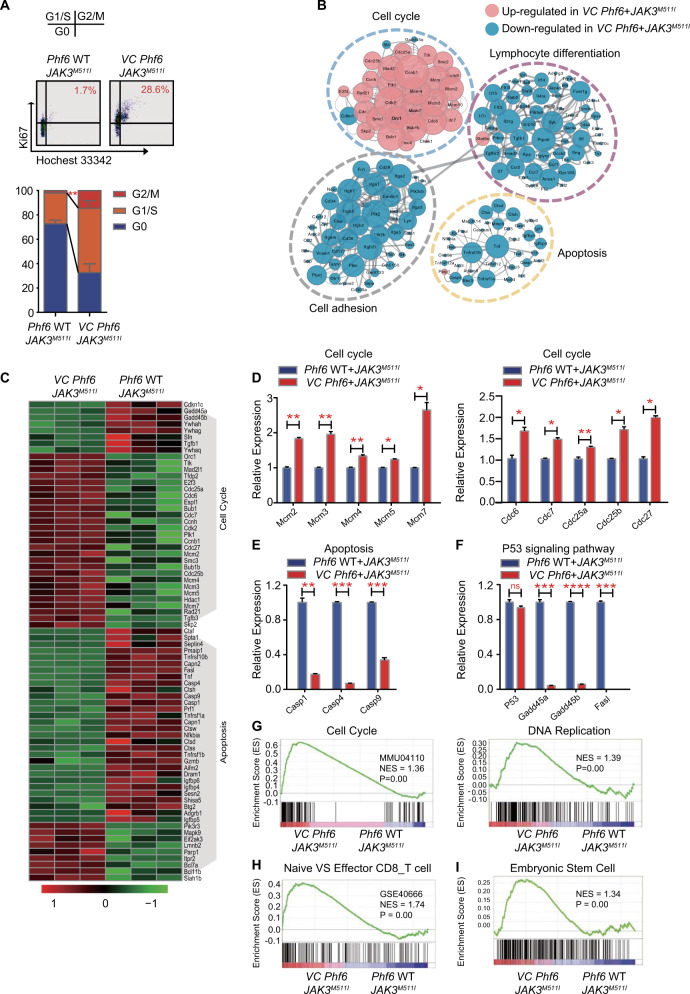
Fig. 5. Phf6 loss accelerates the JAK3M511I T-ALL cell cycle transcriptional profile.
A Representative FACS plots showing the cell cycle of GFP+ cells in BM (upper panel). Percentage of GFP+ cells at each cell cycle stage (lower panel). B Gene interaction analysis showing the significantly altered expression pattern in genes that regulate the cell cycle, lymphocyte differentiation, cell adhesion and apoptosis in VC Phf6 + JAK3M511I T-ALL cells compared with Phf6 WT + JAK3M511I T-ALL cells. C Heatmap of cell cycle-related and apoptosis-related genes. D Validation of the expression of cell cycle-related genes in GFP+ T-ALL cells. E Validation of the expression of apoptosis-related genes in GFP+ T-ALL cells. F Validation of the expression of P53 signaling pathway-targeted genes in GFP+ T-ALL cells. G–I Gene set enrichment analysis (GSEA) of VC Phf6 + JAK3M511I T-ALL cells versus Phf6 WT + JAK3M511I T-ALL cells.

