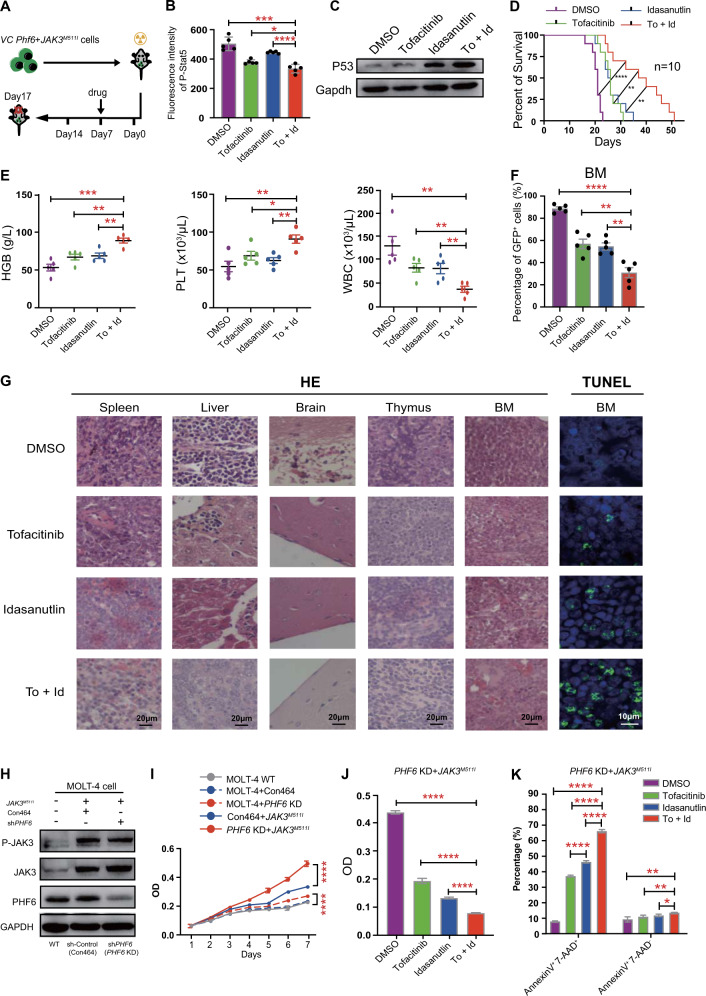
Fig. 7. Combined treatment with tofacitinib and idasanutlin prolonged the survival of Phf6 KO + JAK3M511I T-ALL mice.
A Schematic representation of different drug treatments in VC Phf6 + JAK3M5111 T-ALL mice. B Phosphoflow cytometry was used to measure the phosphorylation level of Stat5 in leukemia cells from VC Phf6 + JAK3M5111 T-ALL mice treated with placebo, single tofacitinib, single idasanutlin, or combined tofacitinib and idasanutlin through oral gavage. C Western blotting was used to assess the expression of P53 in leukemia cells from VC Phf6 + JAK3M5111 T-ALL mice treated with different drugs. D Kaplan–Meier survival curves of VC Phf6 + JAK3M5111 T-ALL mice treated with different drugs (n = 10 per group). Mice treated with combined tofacitinib and idasanutlin VS placebo (log-rank test P < 0.0001), single tofacitinib (log-rank test P = 0.0019) or single idasanutlin (log-rank test P = 0.0034). E The counts of HGB, PLT, and WBC in PB by routine blood tests. F The percentage of GFP+ leukemia cells in BM from VC Phf6 + JAK3M5111 T-ALL mice treated with different drugs. G Immunohistochemical staining for hematoxylin and eosin (HE) (magnification, ×40) and TUNEL staining (green represents TUNEL, blue represents DAPI, magnification, ×60) in BM, spleen, liver, brain, and thymus from VC Phf6 + JAK3M5111 T-ALL mice treated with different drugs. H Construction of PHF6 KD + JAK3M511I and PHF6 Con464 + JAK3M511I MOLT-4 cells and their WB verification. I The proliferation of MOLT-4 PHF6 KD + JAK3M511I cells was much faster than MOLT-4 PHF6 Con464 + JAK3M511I, MOLT-4 PHF6 KD, MOLT-4 Con464 or MOLT-4 WT cells respectively. J, K Proliferation and apoptosis of MOLT-4 PHF6 KD + JAK3M511I cells were examined in vitro with various drug treatment of 0.2% DMSO, single tofacitinib (2.0 μM), single idasanutlin (0.5 μM) or combined tofacitinib + idasanutlin for 48 h.

