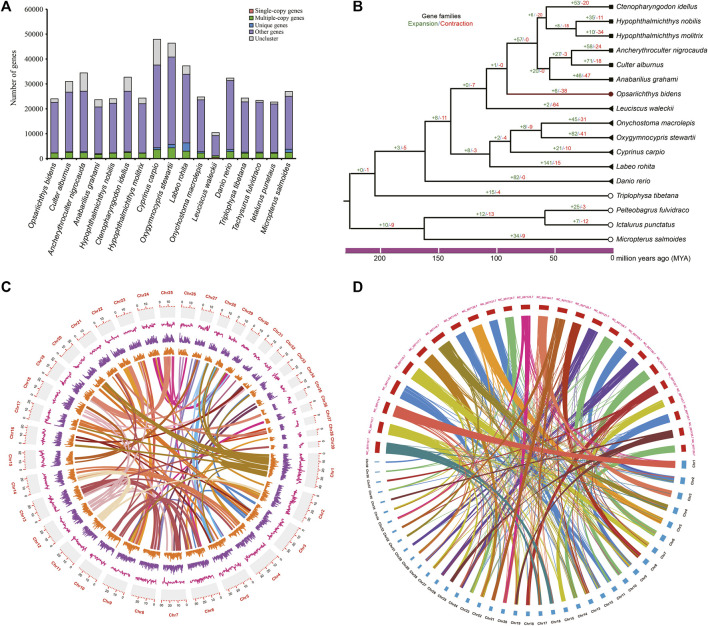
FIGURE 2.
Comparative genome analyses. (A) the number of orthologous for 17 fish species and (B) the phylogenetic tree of 17 fish species; gene family expansions and contractions are indicated in green and red, respectively. (C) Synteny distribution of the 39 chromosomes of O. bidens; The tracks indicate the density of gene numbers and GC contents, respectively. (D) Comparative synteny analysis between O. bidens and Zebrafish.

