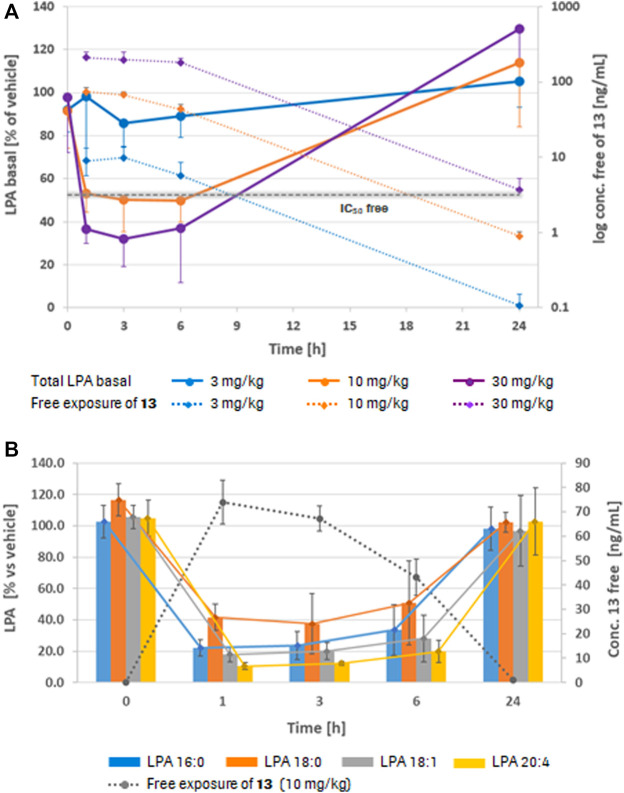
FIGURE 2.
Plasma LPA profiles in rat (PK/PD). (A) Dose and free exposure dependent lowering of total basal plasma LPA in vivo in rat at 1, 3, 6, and 24 h after dosing with 13, normalized to the vehicle control. For all doses (3, 10, and 30 mg/kg po), 5 animals/group were used. (B) Inhibition of the formation of 4 different LPA species in rat plasma after a single oral dose of 13 (10 mg/kg, n = 5) at the same time points, normalized to the vehicle control (LPA formation was measured after incubation of the plasma samples at 37°C for 2 h). Values are mean ± SD.

