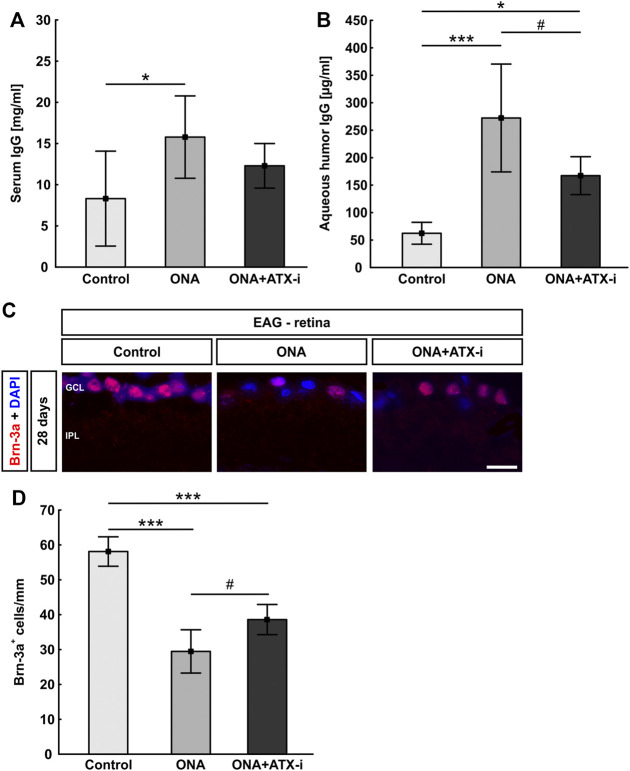
FIGURE 3.
Inhibited immune response and RGC loss in EAG. (A) Serum IgG levels were only increased in the ONA group, but not in ONA + ATX-i animals compared to controls. (B) IgG levels in the aqueous humor were significantly enhanced in ONA and ONA + ATX-i animals. However, in the ONA + ATX-i group, a lower IgG concentration was observable when compared to ONA samples. (C) RGCs were labelled with an antibody against Brn-3a (red), while cell nuclei were counterstained with DAPI (blue). (D) Significantly fewer RGCs were noted in ONA and ONA + ATX-i retinas compared to controls. Nevertheless, significantly more Brn-3a+ RGCs were detected in ONA + ATX-i animals compared to ONA ones. Values are mean ± SD. 6–7 samples/group. Abbreviations: GCL = ganglion cell layer; IPL = inner plexiform layer. Scale bar: 20 μm *p < 0.05; ***p < 0.001; # p < 0.05.

