FIGURE 4.
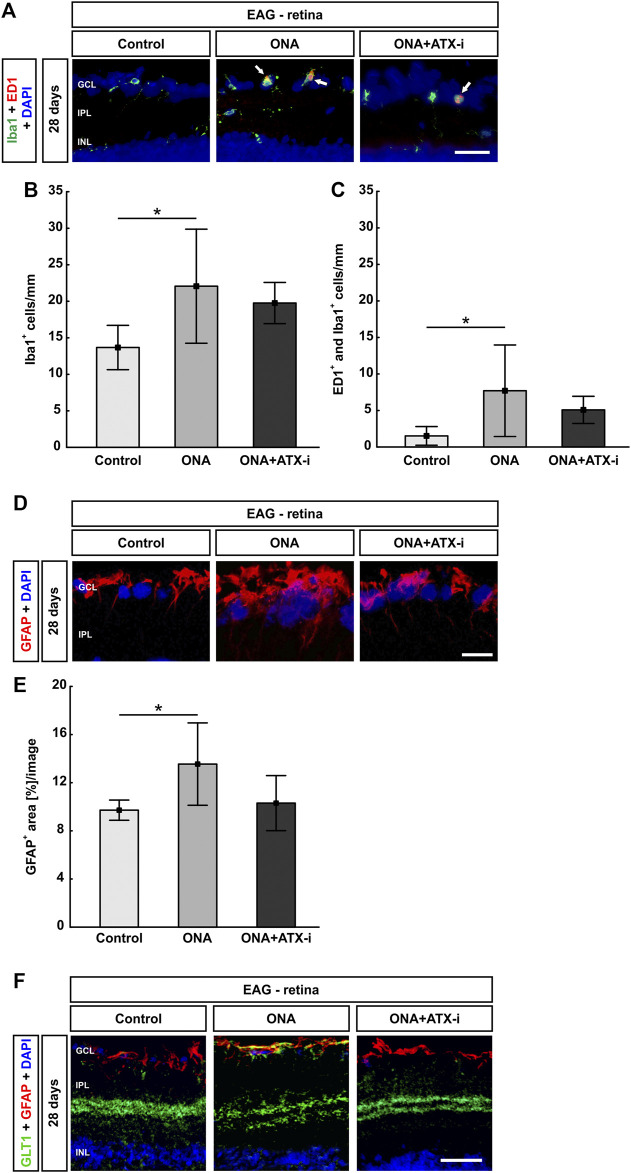
Less glial response in EAG retina. (A) The total number of microglia was stained with an antibody against Iba1 (green) and activated microglia were additionally marked with ED1 (red, arrows). DAPI counterstained cell nuclei (blue). (B) Iba1+ cell numbers were significantly increased in ONA retinas, but not in ONA + ATX-i animals, compared to controls. (C) Furthermore, significantly more activated microglia were only detected in the ONA group. No alterations could be observed in ONA + ATX-i retinas compared to controls. (D) Retinal cross-sections were stained with an antibody against GFAP (red; astrocytes). DAPI (blue) labelled cell nuclei. (E) The GFAP+ area was significantly increased in ONA retinas, but not in ONA + ATX-i animals compared to controls. (F) Retinal cross-sections were co-labelled with antibodies against GFAP (red) and GLT1 (green), while DAPI counterstained cell nuclei (blue). In control as well as in ONA + ATX-i retinas, GLT1 was predominantly observed in the inner plexiform layer. In contrast, enhanced staining patterns in the nerve fiber and GCL, in co-localization with GFAP, could be noted in the ONA group. Values are mean ± SD. 5-6 retinas/group. Abbreviations: GCL = ganglion cell layer; IPL = inner plexiform layer; INL = inner nuclear layer. Scale bars: 20 μm *p < 0.05.

