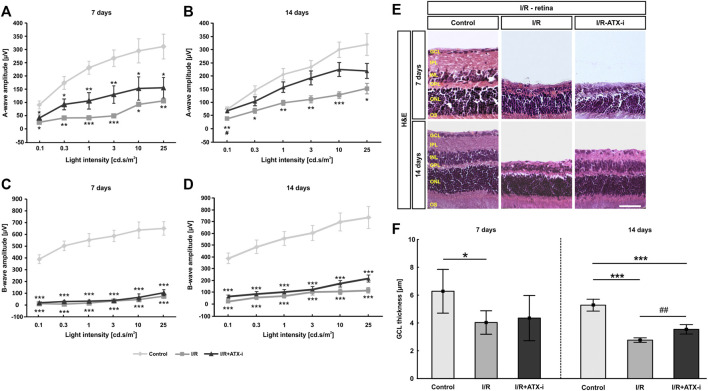
FIGURE 6.
Moderate effect on I/R retinas. (A) After 7 days, recordings of a-wave amplitudes exhibited significant differences between the control and both ischemic groups. (B) 14 days after ischemia induction, a-wave amplitudes of the ischemic group were significant lower when compared to control eyes. Nevertheless, the amplitude reduction in the ATX-I group was less prominent. (C) The I/R and the I/R + ATX-i group revealed significantly lower b-wave amplitudes than the control group 7 days after I/R. (D) 14 days after ischemia, a strong decline of the b-wave amplitudes was detected in both ischemic groups. (E) Staining with H&E was performed 7 as well as 14 days after ischemia induction to visualize the morphology of the retinal layers. (F) At 7 days, the GCL thickness was significantly thinner in I/R retinas compared to control ones. The thickness of the GCL was significantly reduced in the I/R and the I/R + ATX-i group compared to controls at 14 days. However, a broader GCL thickness was revealed in I/R + ATX-i retinas when compared to the I/R group. Values are mean ± SD. (A,B): 5–6 eyes/group; (C,D): 6–7 eyes/group; (E): 5–6 retinas/group; (F): 6–7 retinas/group. Abbreviations: GCL = ganglion cell layer; IPL = inner plexiform layer; INL = inner nuclear layer; OPL = outer plexiform layer; ONL = outer nuclear layer; OS = outer segment. Scale bar: 20 μm *p < 0.05; **p < 0.01; ***p < 0.001; # p < 0.05; ## p < 0.01.

