FIGURE 7.
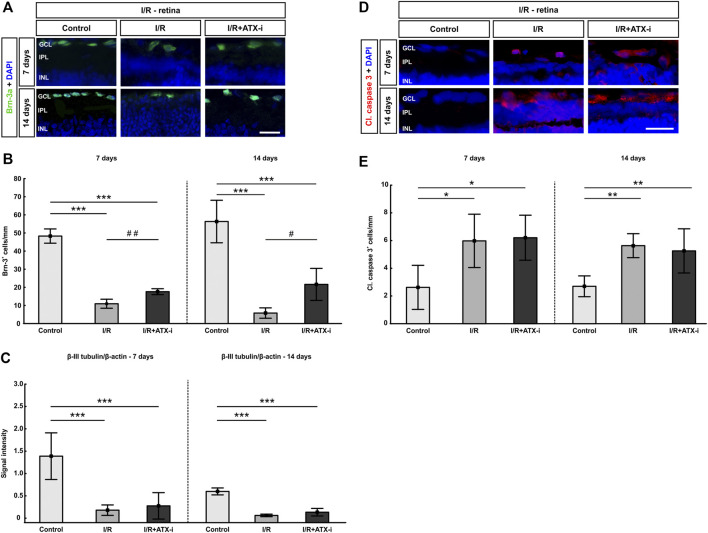
Protection of retinal ganglion cells. (A) Retinal cross-sections stained with anti-Brn-3a (green) to label retinal ganglion cells at 7 and 14 days post I/R. Cell nuclei were visualized with DAPI (blue). (B) At both points in time, a significant lower number of RGCs was detectable in the I/R group and the IR + ATX-i group. However, significantly more RGCs were counted in the I/R + ATX-i group in comparison to the I/R group. (C) Western Blot analysis of retinal samples revealed a significantly less β-III-tubulin in both ischemic groups, the I/R and IR/+ATX-i group, at both points in time when compared to the control group. (D) Immunostaining of apoptotic cells with cleaved caspase 3 (red) after 7 and 14 days. Cell nuclei were labelled with DAPI (blue). (E) The number of cleaved caspase 3+ cells was significantly higher in I/R and I/R + ATX-i retinas compared to controls at 7 and 14 days. Values are mean ± SD. 7 days: 5–6 retinas/group; 14 days: 6–7 retinas/group. Abbreviations: GCL = ganglion cell layer; IPL = inner plexiform layer; INL = inner nuclear layer. Scale bars = 20 μm *p < 0.05; **p < 0.01; ***p < 0.001; # p < 0.05; ## p < 0.01.

