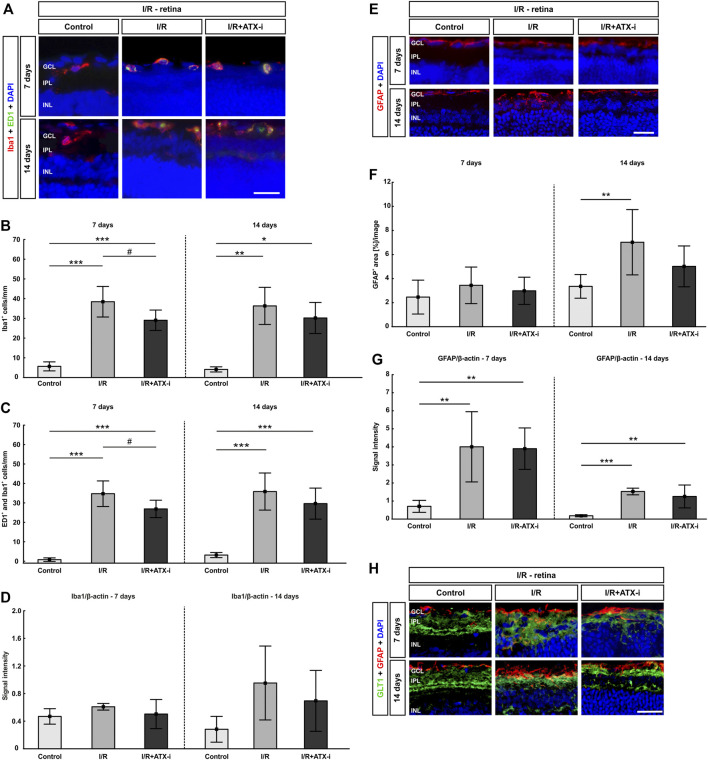
FIGURE 8.
Less retinal microglia after treatment. (A) Double immunostaining of microglia with Iba1 (red) and ED1 (green; active ones) after 7 and 14 days. Cell nuclei were marked with DAPI (blue). (B) Compared to control retinas, the number of Iba1+ microglia was significantly increased in the I/R group and in the I/R + ATX-i group at both points in time. However, 7 days after ischemia induction, significantly fewer Iba1+ cells were noted in the I/R + ATX-i in comparison to the I/R group. (C) Accordingly, significantly more ED1+ and Iba1+ co-labeled microglia were detected in the I/R and I/R + ATX-i group 7 as well as 14 days after I/R. Significantly fewer activated microglia were counted in the I/R + ATX-i group when compared to I/R retinas at 7 days. (D) After 7 days, no differences were seen in Iba1 protein level in retinal samples of both I/R groups via Western Blot. A trend to higher Iba1 protein levels was noted 14 days after ischemia induction in the I/R group, but not in the I/R + ATX-i group in comparison to control retinas. (E) Retinal sections were stained with GFAP (red) to detect astrocytes, while DAPI (blue) counterstained cell nuclei. (F) 7 days after ischemia, no changes could be observed in the I/R and I/R + ATX-i group concerning the GFAP+ area in comparison to the control group. In contrast, 14 days after ischemia, the GFAP+ area was significantly increased in the I/R group, while no changes were detected in the I/R + ATX-i group. (G) GFAP analysis via Western Blot showed a significant increase in GFAP signal intensity in both I/R groups after 7 and 14 days. (H) Retinas were co-labelled with antibodies against GFAP (red) and GLT1 (green). DAPI visualized cell nuclei (blue). In control retinas, GLT1 staining was mostly observed in the inner plexiform layer. A stronger expression of GLT1 and more co-localization with GFAP seemed to appear in the I/R groups, especially at 7 days. In I/R + ATX-i retinas, a co-localization with GFAP was not that prominent anymore. Values are mean ± SD. 7 days: 5–6 retinas/group; 14 days: 6–7 retinas/group. Abbreviations: GCL = ganglion cell layer; IPL = inner plexiform layer; INL = inner nuclear layer. Scale bars = 20 μm *p < 0.05; **p < 0.01; ***p < 0.001; # p < 0.05.

