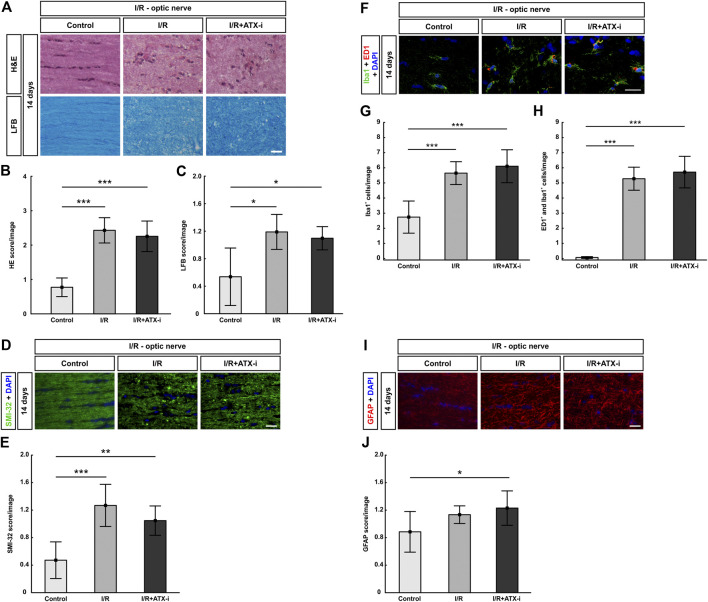
FIGURE 9.
No improvement of I/R optic nerves. (A) 14 days after I/R induction, staining with H&E was performed to visualize the optic nerve morphology and possible cell infiltration, while LFB was used for detection of demyelination signs. (B) Significantly more inflammatory cells (higher H&E score) were observed in the optic nerves of the I/R and the I/R + ATX-i group. (C) A significant loss of myelin (higher LFB score) was noticed in I/R and I/R + ATX-i optic nerves compared to control ones. (D) The longitudinal optic nerve sections were labelled with SMI-32 (green) and DAPI (blue; cell nuclei) to detect possible neurofilament changes. (E) A significant structural distortion was revealed of the optic nerves of the I/R and I/R + ATX-i group. (F) Double immunostaining of microglia with Iba1 (green) and ED1 (red) 14 days post I/R, cell nuclei were marked with DAPI (blue). (G) In comparison to controls, the number of Iba1+ microglia was significantly increased in the I/R and in the I/R + ATX-i group. (H) In accordance, significant more ED1+ and Iba1+ co-labeled cells were detected in the optic nerves of both ischemic groups, with and without ATX-i treatment. (I) Anti-GFAP (red) was used to determine possible alterations in astrocyte expression, while DAPI (blue) counterstained cell nuclei. (J) Scoring of the GFAP-labelled tissue showed a significant higher score in the I/R + ATX-i group in comparison to control optic nerves. Values are mean ± SD. 5–6 nerves/group. Scale bars = 20 μm *p < 0.05; **p < 0.01; ***p < 0.001.

